AP Statistics 2.3 Estimating Probabilities Using Simulation- Exam Style Questions - MCQs - New Syllabus
Question
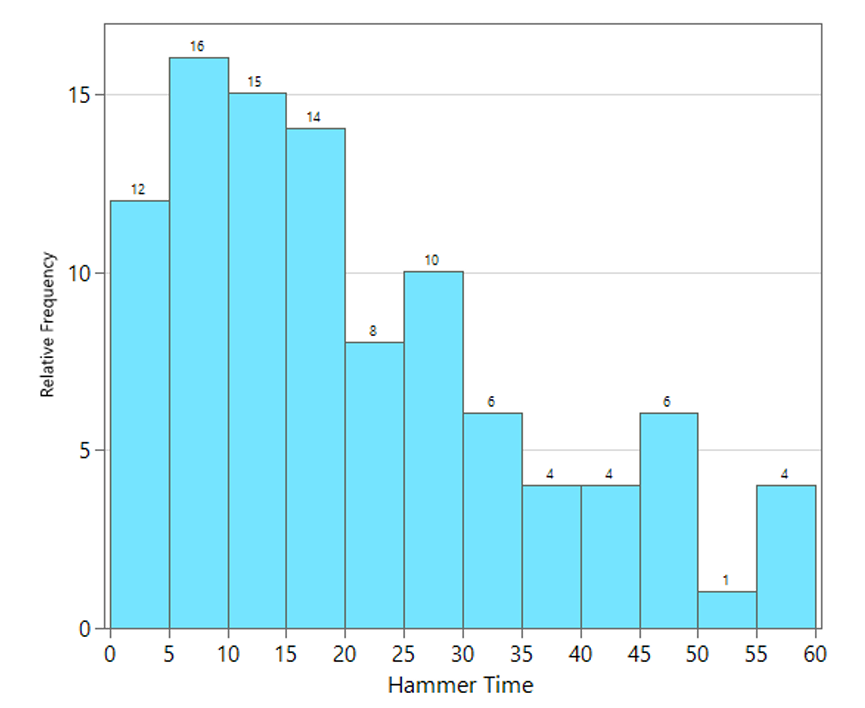
The amount of time (in minutes) spent hammering for an artist to correctly shape a metal bowl was simulated as part of a pitch for a new reality TV show.

Use the graph to estimate the probability that an artist, chosen at random, will spend 40 or more minutes shaping of the bowl.
(A) 0.04
(B) 0.05
(C) 0.08
(D) 0.11
(E) 0.15
▶️ Answer/Explanation
From the histogram, the frequencies for hammer times of 40 minutes or more are:
\(4 + 6 + 1 + 4 = 15\)
The total number of simulated artists is:
\(12+16+15+14+8+10+6+4+4+6+1+4=100\)
Therefore, the estimated probability is:
\(\frac{15}{100}=0.15\)
This means about 15% of the simulated artists spent at least 40 minutes shaping the bowl.
✅ Answer: (E)
Question
For a school fund-raiser, 600 raffle tickets were sold by students at the school, of which 88 were sold by one student, Audrey. Of the 600 tickets sold, 30 were randomly selected to receive prizes, and 7 of the 30 tickets selected were tickets sold by Audrey. To investigate how likely it was by chance alone that at least 7 of the 30 selected tickets could have been sold by Audrey, students in a statistics class ran a simulation. One trial of the simulation is described by the following steps.
Step 1: From 600 chips, assign 88 red and the rest blue.
Step 2: Select 30 chips at random without replacement.
Step 3: Record the number of red chips in the selection of 30.
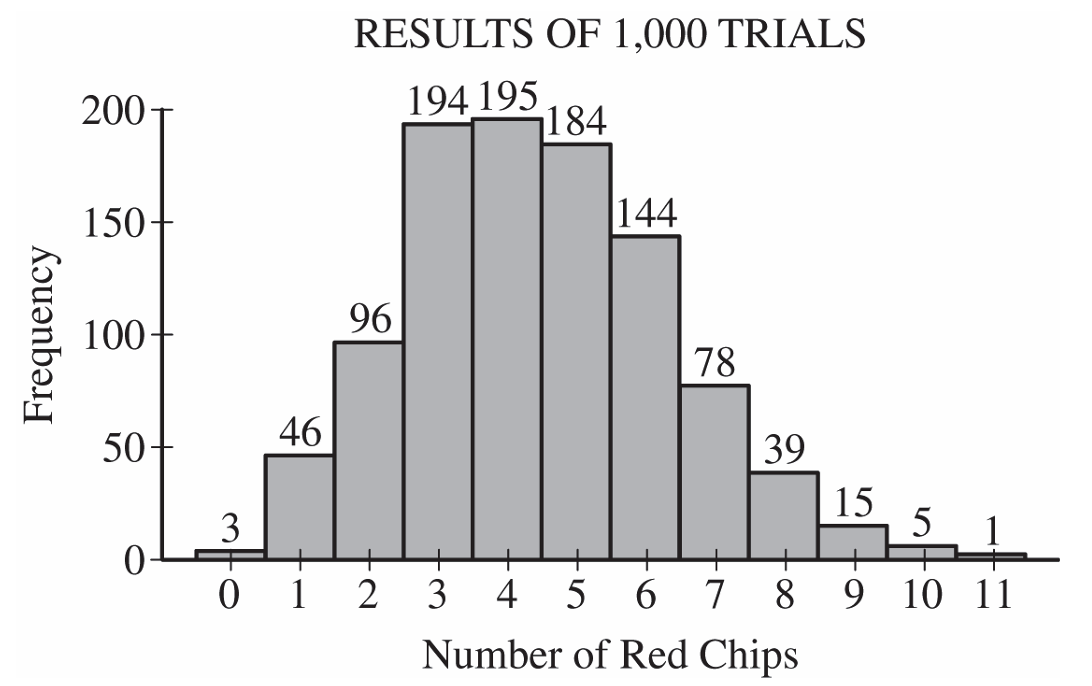
The results of 1,000 trials of the simulation are shown in the histogram.

Based on the results of the simulation, is there convincing statistical evidence at the significance level of 0.05 that the event of Audrey selling at least 7 of the 30 selected tickets is unlikely to have occurred by chance alone?
(A) Yes, because the distribution of the trials in the simulation is skewed to the right.
(B) Yes, because the number in the histogram with the greatest frequency is 4, not 7.
(C) Yes, because 7 appears in the right tail of the distribution, indicating that it is more than 2 standard deviations away from the mean.
(D) No, because the simulation suggests that it is likely that Audrey could sell anywhere from 0 to 11 of the selected tickets.
(E) No, because the simulation suggests that Audrey selling at least 7 of 30 selected tickets would occur about 13.8% of the time.
▶️ Answer/Explanation
To determine whether Audrey selling at least 7 of the 30 selected tickets is unusual, we estimate the probability from the simulation results.
Number of trials with at least 7 red chips:
\(78+39+15+5+1=138\)
Estimated probability:
\(P(X\geq7)=\dfrac{138}{1000}=0.138\)
Since \(0.138\) is much greater than the significance level of \(0.05\), the result is not statistically significant. The simulation suggests that getting at least 7 tickets sold by Audrey would occur about 13.8% of the time by chance alone.
Therefore, there is not convincing evidence that the outcome is unlikely to have occurred by chance.
✅ Answer: (E)

Question
The distribution of colors of candies in a bag is as follows.

If two candies are randomly drawn from the bag with replacement, what is the probability that they are the same color?
(A) 0.09
(B) 0.22
(C) 0.25
(D) 0.75
(E) 0.78
▶️ Answer/Explanation
Step‑by‑step solution:
For each color, let \(p_i\) be the probability of drawing that color from the bag (these probabilities are obtained from the distribution shown in the table). Since the candies are drawn with replacement, the two draws are independent. The probability of drawing two candies of the same specific color is \(p_i \times p_i = p_i^2\). To get the total probability for any color match, we sum over all colors: \(\sum p_i^2\).
From the distribution table, the probabilities are approximately: Brown 0.30, Red 0.25, Yellow 0.15, Green 0.10, Orange 0.12, Blue 0.08 (these values sum to 1.00). Squaring each and adding: \(0.30^2 + 0.25^2 + 0.15^2 + 0.10^2 + 0.12^2 + 0.08^2 = 0.09 + 0.0625 + 0.0225 + 0.01 + 0.0144 + 0.0064 = 0.2058\), which rounds to 0.22.
✅ Correct answer: (B)
