AP Statistics 2.2 Representing Two Categorical Variables- MCQs - Exam Style Questions
Question
College researchers wanted to know under what conditions people are more likely to complete and return a survey. As part of a study, the researchers prepared three sets of identical surveys and used three methods of delivering and returning the surveys. The methods are described as follows.
- In Class: The surveys were given to students in a class, and students were asked to return completed surveys to their instructor.
- Psychology: The surveys were given to students participating in a psychology experiment, and students were asked to return completed surveys to a collection box in the hallway of the psychology building.
- Dining Hall: The surveys were given to students in the dining hall, and students were asked to return completed surveys to a collection box outside the dining hall.
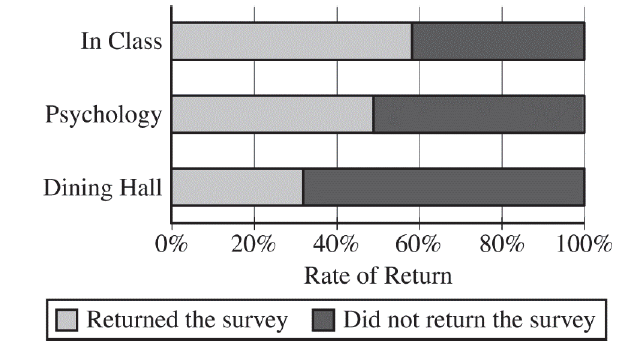
The graph shows the percent of surveys returned and not returned for each delivery method.
(B) There is a negative association between delivery method and rate of return.
(C) The number of surveys given using the Dining Hall delivery method was less than the number given using either of the other delivery methods.
(D) The Psychology delivery method displays the most symmetric results; the other delivery methods display skewed results.
(E) The In Class delivery method had the greatest rate of return, and the Dining Hall delivery method had the least rate of return.
▶️ Answer/Explanation
Read off approximate “Returned” segments from the stacked bars:
• Dining Hall: about \(33\%\) returned.
• Psychology: about \(48\%\) returned.
• In Class: about \(58\%\) returned.
Therefore the highest return rate is In Class and the lowest is Dining Hall. Claims about “association” or “symmetry/skew” are not meaningful from this segmented bar chart, and counts cannot be inferred from percentages alone.
✅ Answer: (E)
Question
| Newspapers | Television | Internet | Other | Total | |
|---|---|---|---|---|---|
| 18-34 | \(12\) | \(35\) | \(40\) | \(6\) | \(93\) |
| 35-54 | \(16\) | \(55\) | \(20\) | \(8\) | \(99\) |
| Over 55 | \(33\) | \(60\) | \(5\) | \(5\) | \(103\) |
| Total | \(61\) | \(150\) | \(65\) | \(19\) | \(295\) |
(B) \(\frac{(99)(150)}{295}\)
(C) \(\frac{(20)(65)}{99}\)
(D) \(\frac{(20)(99)}{295}\)
(E) \(\frac{(20)(65)}{295}\)
▶️ Answer/Explanation
1. Expected Count Formula:
For a chi-square test, the expected count for any cell in a two-way table is calculated as:
\( \text{Expected Count} = \frac{(\text{Row Total}) \times (\text{Column Total})}{\text{Grand Total}} \)
2. Identify the Totals:
– The row of interest is “35-54,” and its total is \(99\).
– The column of interest is “Internet,” and its total is \(65\).
– The grand total for the table is \(295\).
3. Construct the Expression:
Substituting the values into the formula gives \(\frac{(99)(65)}{295}\).
✅ Answer: (A)