
AP Statistics 2.4 Introduction to Probability- Exam Style Questions - FRQs - New Syllabus
Question
ii. Suppose two songs are selected at random to be played. What is the probability that both songs are rock songs? Show your work.
ii. What is the expected value for the random variable in part B (i)? Show your work.
ii. Suppose 4 rock songs are played during a particular one-hour period. Does this provide strong evidence that the song selection process was not truly random? Justify your answer without performing an inference procedure.
Most-appropriate topic codes (AP Statistics):
• Topic \(2.7\) — Independent Events and Unions of Events (Part \( \mathrm{A} \))
• Topic \(2.10\) — The Binomial Distribution (Parts \( \mathrm{B} \), \( \mathrm{C} \))
▶️ Answer/Explanation
A. i.
Let \(R\) represent selecting a rock song.
\(P(R) = \dfrac{\text{Number of rock songs}}{\text{Total number of songs}} = \dfrac{100}{1,000}\)
\(\boxed{P(R) = 0.10}\)
A. ii.
Because any song can be repeated, the selection of the second song is independent of the first.
\(P(\text{Both Rock}) = P(R) \times P(R) = 0.10 \times 0.10\)
\(\boxed{P(\text{Both Rock}) = 0.01}\)
B. i.
• Let \(X\) be the random variable representing the number of rock songs played in a one-hour period.
• The random variable \(X\) follows a binomial distribution, expressed as \(X \sim \text{Binomial}(n = 20, p = 0.10)\).
B. ii.
The expected value of a binomial distribution is given by the formula \(E(X) = n \cdot p\).
\(E(X) = 20 \times 0.10\)
\(\boxed{E(X) = 2\text{ songs}}\)
C. i.
We want to calculate \(P(X \ge 4) = 1 – P(X \le 3)\).
Using the binomial cumulative distribution formula, \(P(X \le 3) = \sum_{k=0}^{3} \binom{20}{k} (0.10)^k (0.90)^{20-k} \approx 0.8670\).
\(P(X \ge 4) = 1 – 0.8670\)
\(\boxed{P(X \ge 4) = 0.1330}\)
C. ii.
• No, this does not provide strong evidence that the song selection process was not truly random.
• The calculated probability of playing 4 or more rock songs is \(0.1330\), which is greater than conventional significance thresholds like \(\alpha = 0.05\), meaning an outcome of 4 rock songs is a relatively common chance occurrence.
Question
Most-appropriate topic codes (AP Statistics):
• Topic 2.10 — The Binomial Distribution (Part \(\mathrm{b}\))
• Topic 2.8 — Introduction to Random Variables and Probability Distributions (Parts \(\mathrm{a}\), \(\mathrm{b}\))
• Topic 2.12 — Sampling Distributions and the Central Limit Theorem (Part \(\mathrm{c}\))
• Topic 4.1 — Sampling Distributions for Sample Means (Part \(\mathrm{c}\))
▶️ Answer/Explanation
(a)
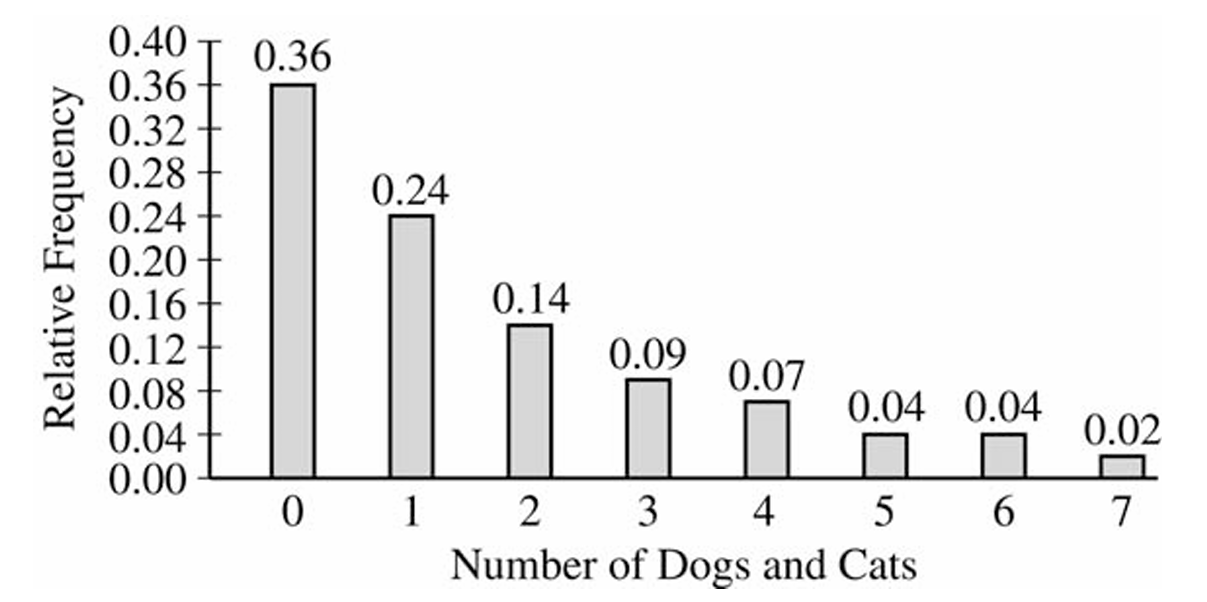
A household is in violation if it owns more than \(3\) pets, i.e., \(X > 3\). Read the relative frequencies for \(X = 4, 5, 6, 7\) directly from the graph and add them up.
\(P(X > 3) = P(X=4) + P(X=5) + P(X=6) + P(X=7)\)
\(P(X > 3) = 0.07 + 0.04 + 0.04 + 0.02\)
\(\boxed{P(X > 3) = 0.17}\)
(b)
Let \(Y\) = the number of households in violation among the \(10\) selected. Since each household is independently either in violation or not, \(Y\) follows a binomial distribution with \(n = 10\) and \(p = 0.17\) (from part (a)).
Using the binomial probability formula \(P(Y = k) = \dbinom{n}{k} p^k (1-p)^{n-k}\):
\(P(Y = 2) = \binom{10}{2}(0.17)^2(0.83)^8\)
\(P(Y = 2) = 45 \times (0.0289) \times (0.2252)\)
\(\boxed{P(Y = 2) \approx 0.2929}\)
(c)
Because the sample size \(n = 150\) is large, the Central Limit Theorem tells us the sampling distribution of \(\bar{X}\) will be approximately normal, regardless of the shape of the original population distribution.
The mean of the sampling distribution equals the population mean:
\(\mu_{\bar{X}} = \mu = 1.65\)
The standard deviation (standard error) of the sampling distribution is:
\(\sigma_{\bar{X}} = \dfrac{\sigma}{\sqrt{n}} = \dfrac{1.851}{\sqrt{150}} \approx 0.1511\)
So the sampling distribution of \(\bar{X}\) is approximately \(N(1.65,\ 0.1511)\) — normal, centered at \(1.65\), with a standard deviation of about \(0.1511\).
Question
Most-appropriate topic codes (AP Statistics):
• Topic 2.7 — Independent Events and Unions of Events (Part a,b)
• Topic 2.4 — Introduction to Probability (Part b)
• Topic 2.3 — Estimating Probabilities Using Simulation (Part c)
•Topic 1.12 — Potential Problems with Sampling (Part d)
▶️ Answer/Explanation
(a)
The probability distribution of \(X\) is not binomial because the bones are selected without replacement from a finite population of only 20 femurs. For a binomial distribution to apply, each trial must be independent — that is, the probability of success (selecting a male femur) must remain constant from one draw to the next. However, when sampling without replacement, the composition of the remaining pool changes with each selection, so the probability of drawing a male femur on each successive draw depends on what was drawn before it. Since the trials are not independent and the probability of success is not fixed, the distribution of \(X\) is hypergeometric, not binomial.
\(\boxed{X \text{ is not binomial because sampling is without replacement, making trials dependent}}\)
(b)
With 10 males and 10 females among the 20 brontosaurs, compute the probability that all 4 selected femurs are male using the multiplication rule for dependent events (without replacement):
\(P(\text{1st is male}) = \dfrac{10}{20}\)
\(P(\text{2nd is male} \mid \text{1st is male}) = \dfrac{9}{19}\)
\(P(\text{3rd is male} \mid \text{first two are male}) = \dfrac{8}{18}\)
\(P(\text{4th is male} \mid \text{first three are male}) = \dfrac{7}{17}\)
Therefore:
\(P(\text{all 4 are male}) = \dfrac{10}{20} \times \dfrac{9}{19} \times \dfrac{8}{18} \times \dfrac{7}{17}\)
\(= \dfrac{10 \times 9 \times 8 \times 7}{20 \times 19 \times 18 \times 17} = \dfrac{5040}{116280} \approx 0.0433\)
This can also be expressed using combinations:
\(P(\text{all 4 are male}) = \dfrac{\dbinom{10}{4}}{\dbinom{20}{4}} = \dfrac{210}{4845} \approx 0.0433\)
\(\boxed{P(\text{all 4 male}) \approx 0.0433}\)
(c)
No, it does not seem likely that males and females were equally represented in the group of 20 brontosaurs. From part (b), if the group had exactly 10 males and 10 females, the probability of randomly selecting 4 males in a row is only about \(4.33\%\). Since this probability is quite small (less than 5%), observing all 4 selected femurs being male is an unusual result under the assumption of equal representation. It is therefore more reasonable to think that males outnumbered females in this particular group of brontosaurs trapped in the swamp, though equal representation is possible — just unlikely given the data.
\(\boxed{\text{Equal representation is unlikely; evidence suggests more males than females in the group}}\)
(d)
No, it is not reasonable to generalize the conclusion from part (c) to the entire population of brontosaurs. The 20 brontosaurs found at the site do not constitute a random sample from the population of all brontosaurs — they represent only those individuals that happened to wander into that particular swamp and become trapped. This is a highly specific and non-random group. It is plausible that behavioral differences between male and female brontosaurs (for example, males may have been more likely to venture into deep swamp areas while foraging) could explain why males are overrepresented in this particular site. Such a non-representative sample cannot be used to draw conclusions about the broader population of all brontosaurs.
\(\boxed{\text{Cannot generalize; the 20 brontosaurs are not a random sample of all brontosaurs}}\)