AP Statistics 2.4 Introduction to Probability- Exam Style Questions - MCQs - New Syllabus
Question
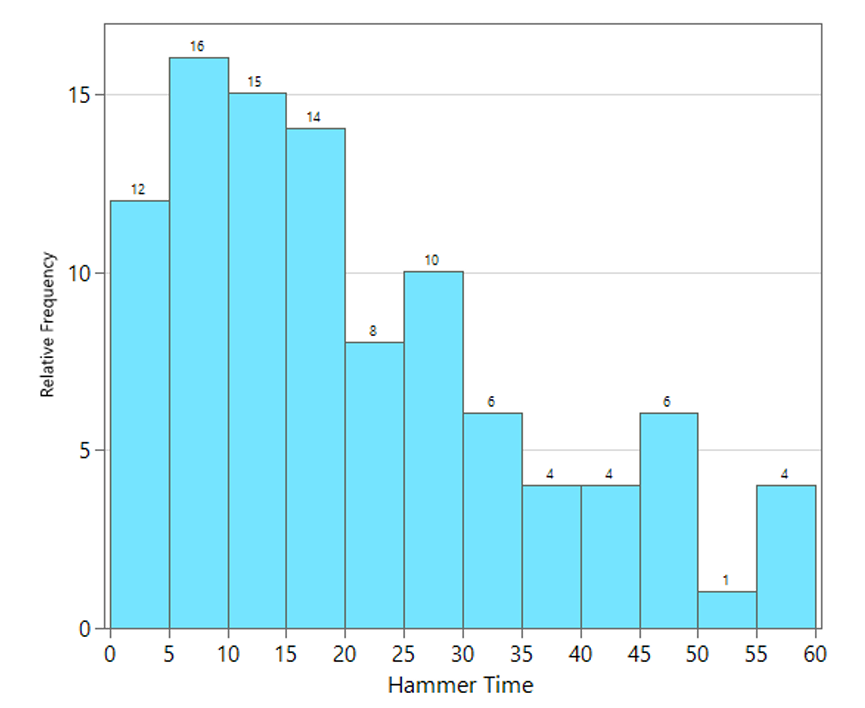
The amount of time (in minutes) spent hammering for an artist to correctly shape a metal bowl was simulated as part of a pitch for a new reality TV show.

Use the graph to estimate the probability that an artist, chosen at random, will spend 40 or more minutes shaping of the bowl.
(A) 0.04
(B) 0.05
(C) 0.08
(D) 0.11
(E) 0.15
▶️ Answer/Explanation
From the histogram, the frequencies for hammer times of 40 minutes or more are:
\(4 + 6 + 1 + 4 = 15\)
The total number of simulated artists is:
\(12+16+15+14+8+10+6+4+4+6+1+4=100\)
Therefore, the estimated probability is:
\(\frac{15}{100}=0.15\)
This means about 15% of the simulated artists spent at least 40 minutes shaping the bowl.
✅ Answer: (E)
Question
The Very Good Cookie company manufactures cookies with a mean weight of 3.1 grams and a standard deviation of 0.25 grams. The distribution of weights of cookies is approximately normal. Cookies more than 0.4 grams away from the mean weight are removed before packaging and recycled for other products, such as ice cream. Which is closest to the probability that a randomly selected cookie will be recycled for use in other products?
(A) 0.06
(B) 0.11
(C) 0.32
(D) 0.69
(E) 0.89
▶️ Answer/Explanation
A cookie is recycled if its weight is more than 0.4 grams away from the mean of 3.1 grams. Therefore, we want:
\(P(|X-3.1|>0.4)\)
Convert 0.4 grams to a z-score:
\(z=\frac{0.4}{0.25}=1.6\)
Thus we need the probability outside the interval:
\(-1.6<Z<1.6\)
Using the standard normal distribution:
\(P(Z<1.6)\approx0.9452\)
\(P(Z<-1.6)\approx0.0548\)
So the probability within 1.6 standard deviations is:
\(0.9452-0.0548=0.8904\)
The probability of being recycled is the probability in both tails:
\(1-0.8904=0.1096\)
\(\approx0.11\)
Therefore, the probability that a randomly selected cookie will be recycled is approximately 0.11.
✅ Answer: (B)
Question
Lynn is planning to fly from New York to Los Angeles and will take the Airtight Airlines flight that leaves at 8 A.M. The Web site she used to make her reservation states that the probability that the flight will arrive in Los Angeles on time is 0.70. Of the following, which is the most reasonable explanation for how that probability could have been estimated?
(A) By using an extended weather forecast for the date of her flight, which showed a 30% chance of bad weather
(B) By making assumptions about how airplanes work, and factoring all of those assumptions into an equation to arrive at the probability
(C) From the fact that, of all airline flights arriving in California, 70% arrive on time
(D) From the fact that, of all airline flights in the United States, 70% arrive on time
(E) From the fact that, on all previous days this particular flight had been scheduled, it had arrived on time 70% of those days
▶️ Answer/Explanation
A probability of 0.70 is most reasonably estimated using historical data from the same flight. This is known as an empirical probability, which is based on the long-run relative frequency of an event.
If this specific flight has arrived on time 70% of the days it has previously been scheduled, then:
\( P(\text{On Time}) \approx 0.70 \)
Using data from all flights in California or the entire United States would be much less relevant because those flights may have very different routes, schedules, and operating conditions.
✅ Answer: (E)
