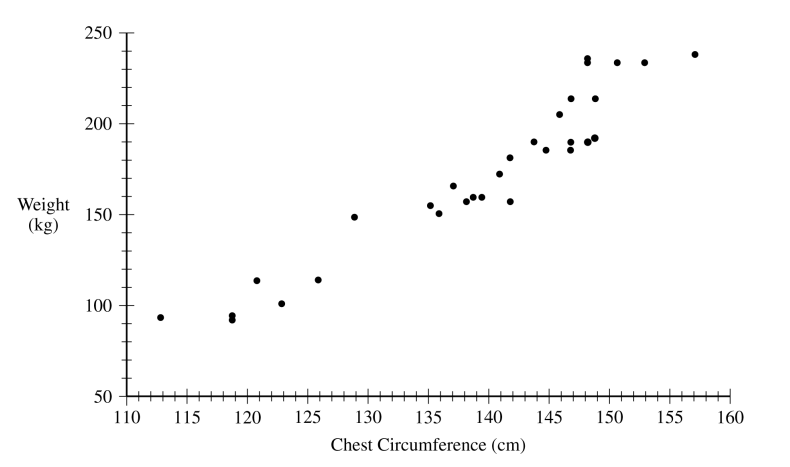
Wildlife biologists are interested in the health of tule elk, a species of deer found in California. An important measurement of tule elk health is their weight. The weight of a tule elk is difficult to measure in the wild. However, chest circumference, which is believed to be related to the weight of a tule elk, can easily be measured from a safe distance using a harmless laser. A study was done to investigate whether chest circumference, in centimeters (cm), could be used to accurately estimate the weight, in kilograms (kg), of male tule elk. For the study, wildlife biologists captured \(30\) male tule elk, measured their chest circumference and weight, and then released the elk. The data for the \(30\) male tule elk are shown in the scatterplot.
(a) Describe the relationship between chest circumference and weight of male tule elk in context.
Following is the equation of the least-squares regression line relating chest circumference and weight for male tule elk.
predicted weight \( = -350.3 + 3.7455(\text{chest circumference})\)
(b) The weight of one male tule elk with a chest circumference of \(145.9\) cm is \(204.3\) kg.
(i) Using the equation of the least-squares regression line, calculate the predicted weight for this male tule elk. Show your work.
(ii) Calculate the residual for this male tule elk. Show your work.
The equation of the least-squares regression line relating chest circumference and weight for male tule elk is repeated here.
predicted weight \( = -350.3 + 3.7455(\text{chest circumference})\)
(c) Interpret the slope of the least-squares regression line in context.
(d) The sambar, another species of deer, is similar in size to the tule elk. The slope of the population regression line relating chest circumference and weight for all male sambars is \(4.5\) kilograms per centimeter. A wildlife biologist wants to determine whether the slope of the population regression line for male tule elk is different than that for male sambars. Let \(\beta\) represent the slope of the population regression line for male tule elk. The wildlife biologist conducted a test of the following hypotheses using the sample of \(30\) tule elk.
\[
\begin{aligned}
H_0 &: \beta = 4.5 \\
H_a &: \beta \ne 4.5
\end{aligned}
\]
The test statistic was calculated to be \(3.408\). Assume all conditions for inference were met.
(i) Determine the p-value of the test.
(ii) At a significance level of \(\alpha=0.05\), what conclusion should the wildlife biologist make regarding the slope of the population regression line for male tule elk? Justify your response.
Most-appropriate topic codes (CED):
• TOPIC 2.4: Representing the Relationship Between Two Quantitative Variables
• TOPIC 2.7: Residuals
• TOPIC 2.8: Least Squares Regression
• TOPIC 9.5: Carrying Out a Test for the Slope of a Regression Model