Home / AP® Exam / AP® Statistics / 2.4 Representing the Relationship Between Two Quantitative Variables- MCQs

AP Statistics 2.4 Representing the Relationship Between Two Quantitative Variables- MCQs - Exam Style Questions

Question

Athletes in a particular sport are classified as either offense or defense. The distribution of weights for the athletes classified as offense is approximately normal, centered at 200 pounds, and ranges from 150 pounds to 250 pounds. The distribution of weights for the athletes classified as defense is approximately normal, centered at 300 pounds, and ranges from 250 pounds to 350 pounds. There are 1,000 athletes in each classification. Which of the following is the best description of a histogram of the weights of all 2,000 athletes?
(A) Skewed to the right (positively skewed)
(B) Skewed to the left (negatively skewed)
(C) Approximately uniform and centered at 250 pounds
(D) Approximately normal and centered at 250 pounds
(E) Bimodal
▶️ Answer/Explanation
Detailed solution

The overall distribution is a combination of two distinct, approximately normal distributions with different centers (one at \(200\) lbs for offense, one at \(300\) lbs for defense). When plotted on a single histogram, this will create a distribution with two distinct peaks, or modes. A distribution with two peaks is described as bimodal.
Answer: (E)

Question

A field researcher who studies lions conjectured that the more time a cub spends playing, the sooner the cub will begin to hunt. Observational data were collected from \(20\) lion cubs. The researcher recorded how long they spent playing and the age when they began hunting. Because male and female lions have different hunting behaviors, the researcher recorded the data for males and females separately. The two scatterplots show the data for the \(10\) female lions and the \(10\) male lions.
Based on the scatterplots, for which gender does there appear to be evidence that the more time a lion cub spends playing, the sooner the cub is likely to begin hunting?
(A) For female cubs only
(B) For male cubs only
(C) For both male cubs and female cubs, with equal evidence
(D) For both male cubs and female cubs, with more evidence for female cubs than for male cubs
(E) For neither male cubs nor female cubs
▶️ Answer/Explanation
Detailed solution

1. Analyze the Conjecture:
The researcher’s conjecture (“more time playing, the sooner to hunt”) implies a **negative association** between play time (x-axis) and age at first hunt (y-axis).

2. Analyze the Scatterplots:
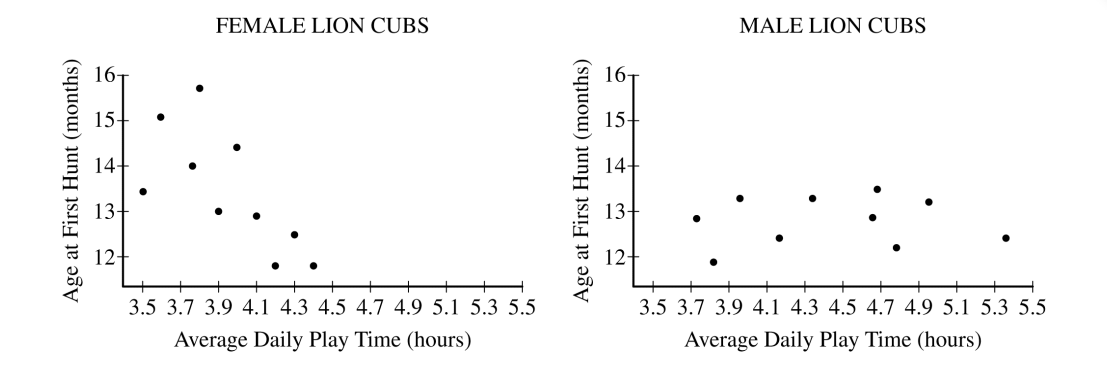
– **Female Lion Cubs:** The scatterplot shows a clear negative trend. As the average daily play time increases, the age at first hunt tends to decrease.
– **Male Lion Cubs:** The scatterplot shows no clear pattern or trend. The points are scattered randomly.

The evidence for a negative association exists only for the female cubs.
Answer: (A)

Scroll to Top