▶️ Answer/Explanation
(a)
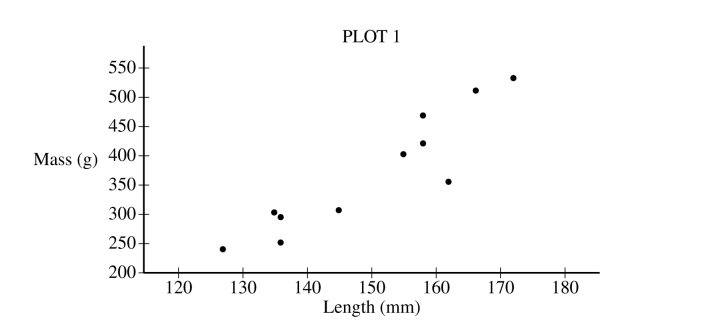
The scatterplot reveals a strong, positive, roughly linear association between the mass and length of bullfrogs. There are no points that seriously deviate from the straight-line pattern exhibited by most of the points in the plot.
(b)
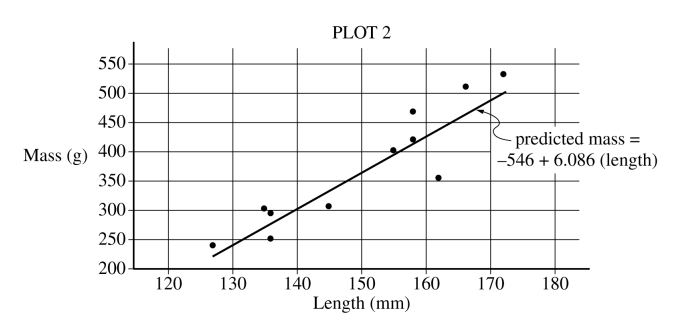
The slope of the least-squares regression line is \( 6.086 \). This indicates that for each additional millimeter of length, the predicted mass of a bullfrog increases by 6.086 grams.
(c)
The coefficient of determination \( r^2 \approx 0.819 \) indicates that 81.9% of the variation in bullfrog mass can be explained by the linear relationship with bullfrog length as described by the least-squares regression line.
(d)
(i) The bullfrog with the largest absolute value residual has a length of approximately 162 mm and a mass of approximately 356 g.
(ii) The least-squares regression line overestimates the mass of this bullfrog. This is evident because the point for this bullfrog is below the regression line in Plot 2, meaning the actual mass is less than the predicted mass.