AP Statistics 2.6 Linear Regression Models- FRQs - Exam Style Questions
Question
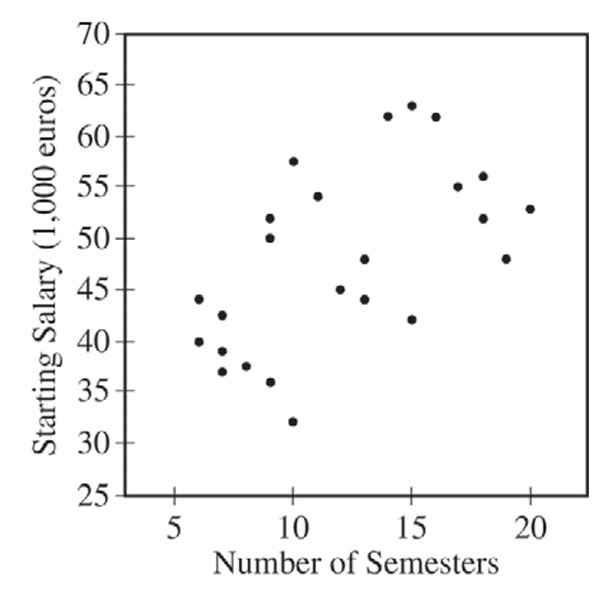
A newspaper in Germany reported that the more semesters needed to complete an academic program at the university, the greater the starting salary in the first year of a job. The report was based on a study that used a random sample of \(24\) people who had recently completed an academic program. Information was collected on the number of semesters each person in the sample needed to complete the program and the starting salary, in thousands of euros, for the first year of a job. The data are shown in the scatterplot below.

(a) Does the scatterplot support the newspaper report about number of semesters and starting salary? Justify your answer.
The table below shows computer output from a linear regression analysis on the data.
| Predictor | Coef | SE Coef | T | P |
|---|---|---|---|---|
| Constant | \(34.018\) | \(4.455\) | \(7.64\) | \(0.000\) |
| Semesters | \(1.1594\) | \(0.3482\) | \(3.33\) | \(0.003\) |
\(S = 7.37702 \quad R-Sq = 33.5\% \quad R-Sq(adj) = 30.5\%\)
(b) Identify the slope of the least-squares regression line, and interpret the slope in context.
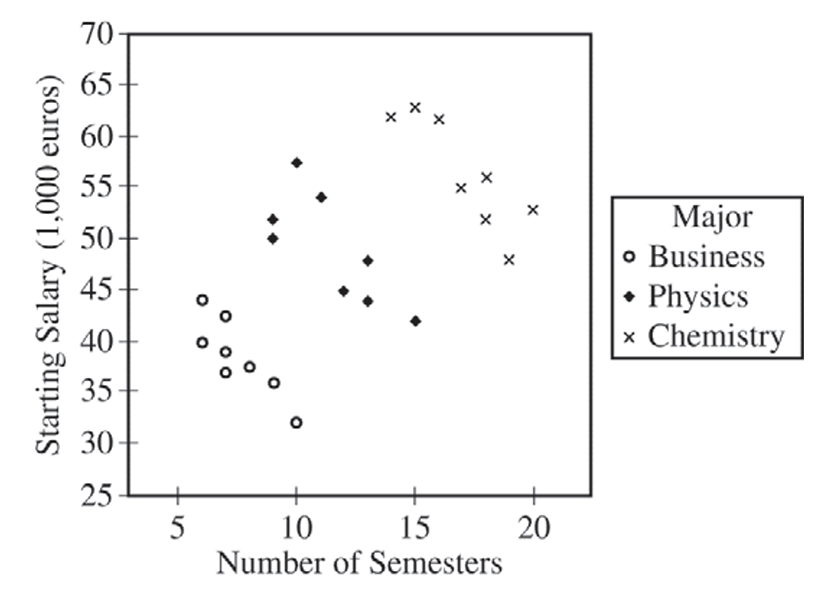
An independent researcher received the data from the newspaper and conducted a new analysis by separating the data into three groups based on the major of each person. A revised scatterplot identifying the major of each person is shown below.

(c) Based on the people in the sample, describe the association between starting salary and number of semesters for the business majors.
(d) Based on the people in the sample, compare the median starting salaries for the three majors.
(e) Based on the analysis conducted by the independent researcher, how could the newspaper report be modified to give a better description of the relationship between the number of semesters and the starting salary for the people in the sample?
Most-appropriate topic codes (CED):
• TOPIC 2.5: Correlation
• TOPIC 2.6: Linear Regression Models
• TOPIC 2.9: Analyzing Departures from Linearity
▶️ Answer/Explanation
(a)
The scatterplot shows a positive association between number of semesters and starting salary. As the number of semesters increases, the starting salary generally increases, which supports the newspaper report. \(\boxed{\text{Yes}}\)
(b)
The slope is \(1.1594\). Interpretation: For each additional semester needed to complete an academic program, the predicted starting salary increases by €1,159.40. \(\boxed{1.1594}\)
(c)
For business majors alone, there is a strong, negative, linear association between number of semesters and starting salary. Business majors who take more semesters tend to have lower starting salaries. \(\boxed{\text{Strong negative linear association}}\)
(d)
Business majors have the lowest median starting salary (approximately €38,000), physics majors have a middle median starting salary (approximately €48,000), and chemistry majors have the highest median starting salary (approximately €55,000). \(\boxed{\text{Chemistry > Physics > Business}}\)
(e)
The newspaper report should be modified to account for the different majors. While there is an overall positive association between semesters and salary across all majors, within each major (especially business) there is actually a negative association where more semesters correlate with lower starting salaries. \(\boxed{\text{Account for major}}\)
