▶️ Answer/Explanation
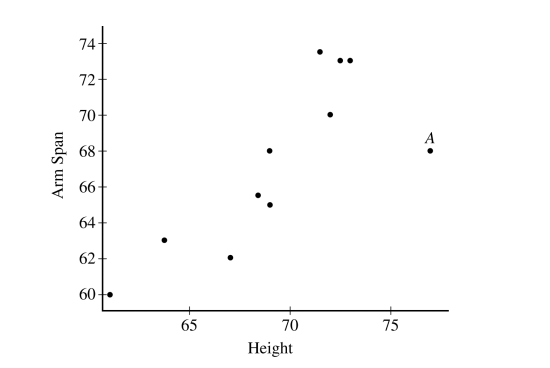
1. Analyze Point A:
Point A is an influential point. It has a high x-value (height) but a y-value (arm span) that is much lower than the general positive trend of the other points.
2. Effect on Slope:
Because point A is far to the right and below the main pattern, it acts as a lever, pulling the regression line down on the right side. Removing this point would cause the right end of the line to “spring up,” resulting in an **increase** in the slope.
3. Effect on Correlation:
Point A does not follow the linear pattern of the other points; it weakens the association. Removing this outlier will make the remaining points appear more tightly clustered along a line, thus **increasing** the correlation coefficient (making it stronger and more positive).
✅ Answer: (C)
▶️ Answer/Explanation
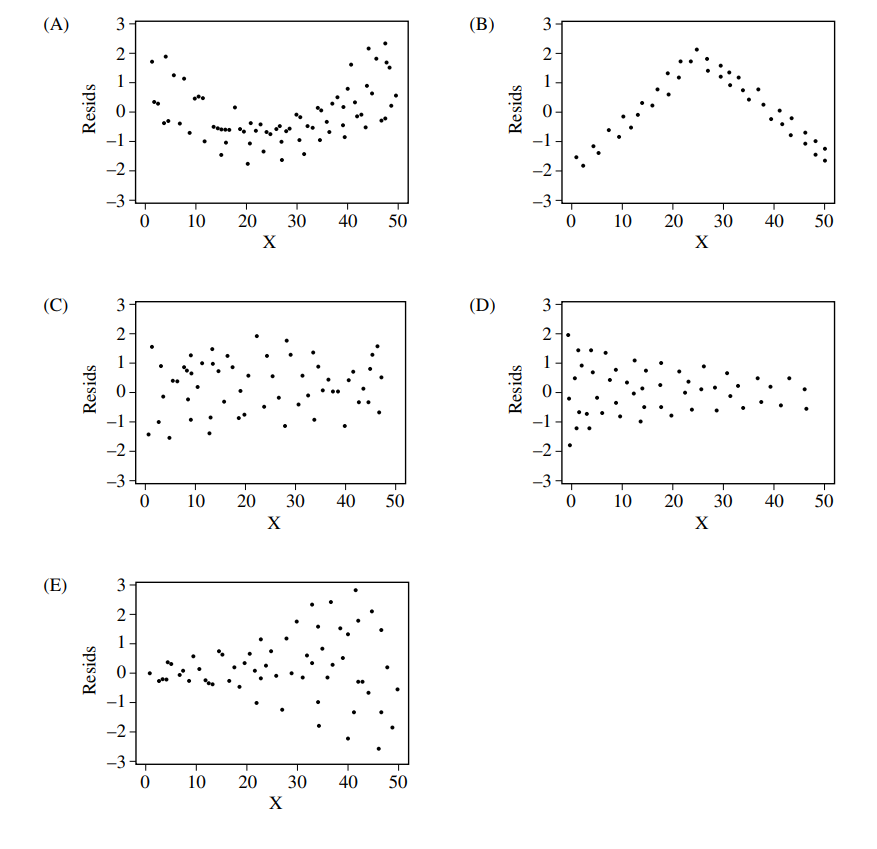
1. Understand the conditions for a good residual plot:
For a linear model to be appropriate, the residual plot should show no obvious patterns. It should have a random scatter of points above and below the horizontal line at \(0\), and the vertical spread of the points should be roughly the same across all x-values (constant variance or homoscedasticity).
2. Analyze the given plots:
– Plot (A) and Plot (B) show clear curved patterns (U-shape and inverted U-shape). This indicates that a linear model is not appropriate.
– Plot (D) shows that the variability of the residuals increases as the value of X increases (heteroscedasticity or a fanning effect). This violates the assumption of constant variance.
– Plot (E) shows a systematic pattern, suggesting the data may not be independent (e.g., time-series data).
– Plot (C) is the only plot that shows a random, formless scatter of points centered around \(0\) with roughly constant variance. This is the ideal appearance for a residual plot, indicating that the linear model is appropriate.
✅ Answer: (C)