AP Statistics 3.1 Estimators- Exam Style Questions - MCQs - New Syllabus
Question
In 2021, information from the US Census indicated that 29% of US households were single person households. In 2022, a group of researchers surveyed 1000 random US households and found that 310 of these households were single person households. The researchers computed a 95% confidence interval for the percentage of single person US households to be (0.2813, 0.3387). What can we claim based on the calculations provided here?
(A) There is sufficient evidence at the 0.05 level of significance to indicate there is no difference in the percentage of single person US households between 2021 and 2022.
(B) There is sufficient significant evidence at the 0.05 level of significance to suggest there is a difference in the percentage of single person US households between 2021 and 2022.
(C) There is not sufficient evidence at the 0.05 level of significance to suggest a significant difference in the percentage of single person US households between 2021 and 2022.
(D) All new samples of 1000 US households in 2022 will show the percentage of single person households as between 28.13 and 33.87 percent.
(E) The percentage of single person households in 2021 and 2022 is the same.
▶️ Answer/Explanation
The 95% confidence interval for the 2022 proportion of single-person households is:
\((0.2813,\;0.3387)\)
The 2021 Census value was:
\(p=0.29\)
Notice that:
\(0.2813 < 0.29 < 0.3387\)
Since the 2021 value of 0.29 lies within the 95% confidence interval, it is a plausible value for the 2022 population proportion. Therefore, the data do not provide sufficient evidence that the proportion of single-person households changed between 2021 and 2022.
A confidence interval that contains the hypothesized value corresponds to failing to reject the null hypothesis in a two-sided significance test at the matching significance level.
Therefore, there is not sufficient evidence at the 0.05 significance level to conclude that a significant difference exists.
✅ Answer: (C)
Question
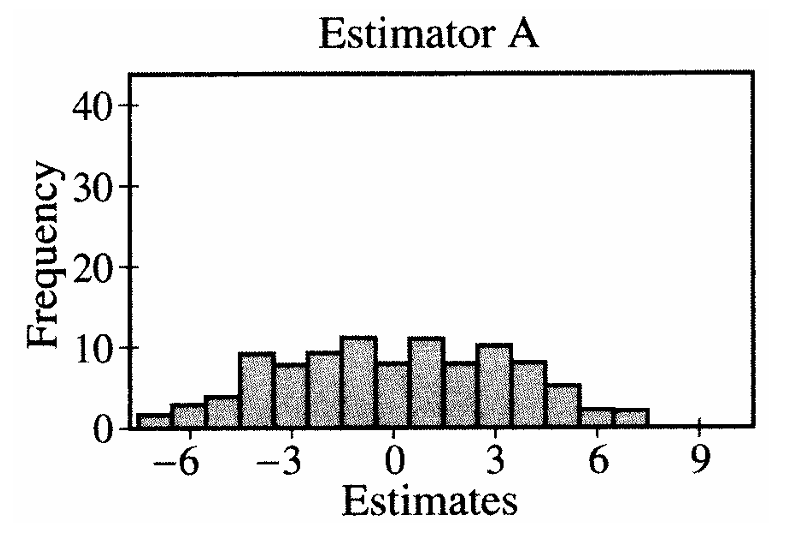
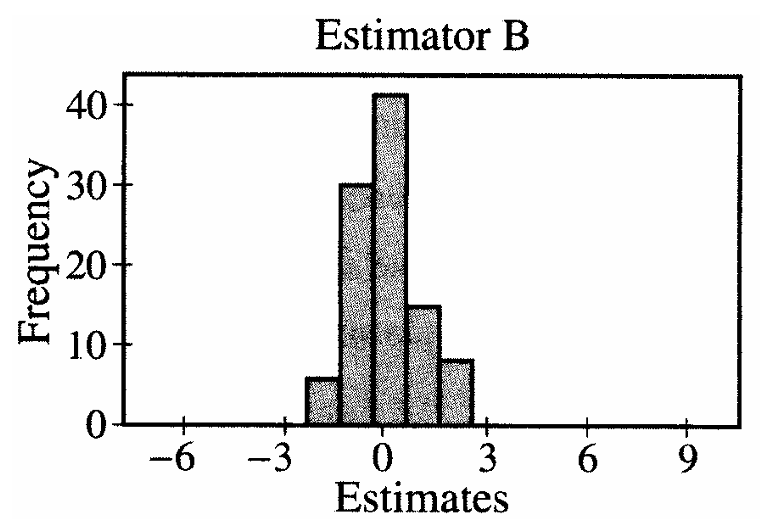
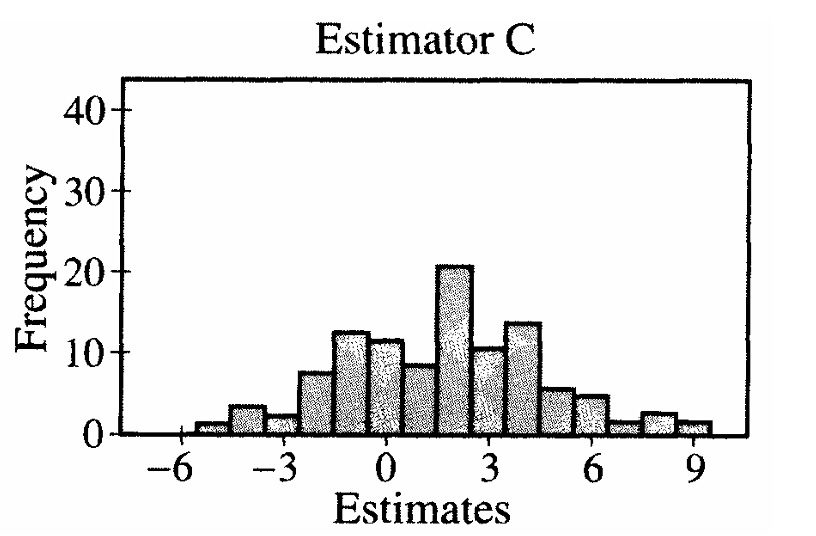
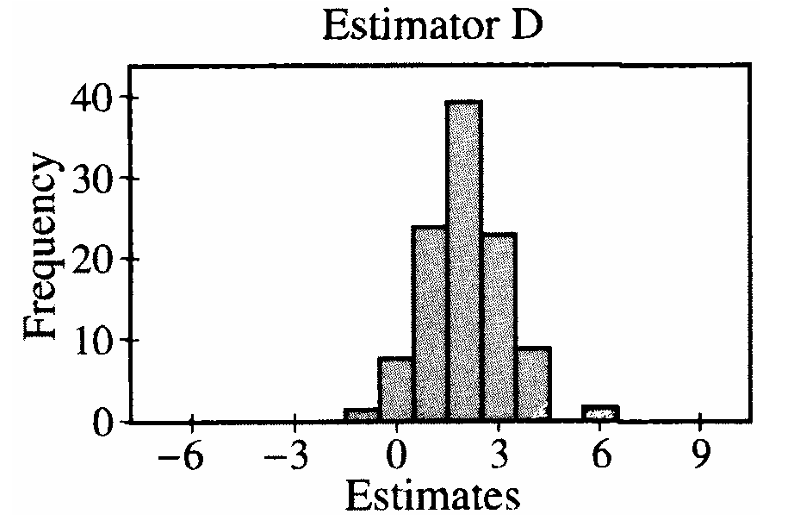
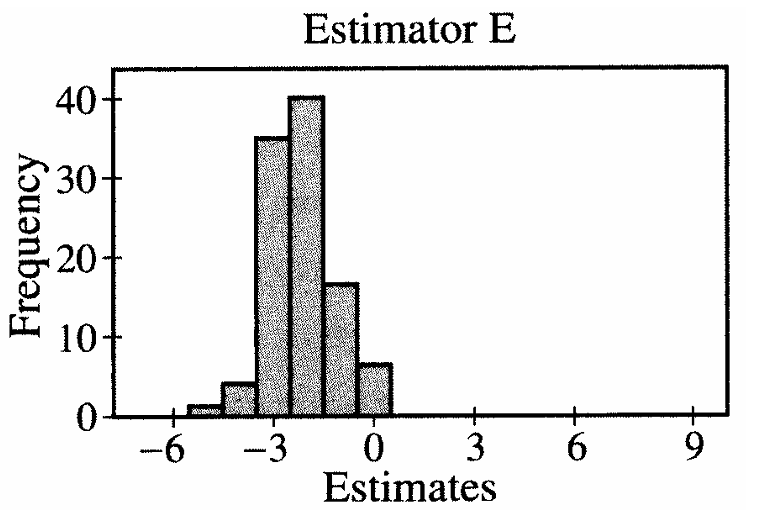
Five estimators for a parameter are being evaluated. The true value of the parameter is 0. Simulations of 100 random samples, each of size \(n\), are drawn from the population. For each simulated sample, the five estimates are computed. The histograms below display the simulated sampling distributions for the five estimators. Which simulated sampling distribution is associated with the best estimator for this parameter?
(A) 
(B) 
(C) 
(D) 
(E) 
▶️ Answer/Explanation
A good estimator should have two important properties:
• Unbiased — its sampling distribution should be centered at the true parameter value.
• Low variability — its sampling distribution should be as narrow as possible.
The true parameter value is:
\( \theta = 0 \)
Looking at the histograms:
• Estimator A is centered near 0 but has very large variability.
• Estimator C is not centered at 0 and has substantial variability.
• Estimator D has small variability but is centered around 2, showing bias.
• Estimator E has very small variability but is centered around \(-2\), also biased.
• Estimator B is centered near 0 and has the smallest variability among the unbiased estimators.
Therefore, Estimator B is the best estimator because it is approximately unbiased and has relatively low spread.
✅ Answer: (B)
Question
A biologist studying trees constructed the confidence interval \((0.14, 0.20)\) to estimate the proportion of trees in a large forest that are dead but still standing. Using the same confidence level, the interval was later revised because the sample proportion had been miscalculated. The correct sample proportion was 0.27. Which of the following statements about the revised interval based on the correct sample proportion is true?
(A) The revised interval is narrower than the original interval because the correct sample proportion is farther from 0.5 than the miscalculated proportion is.
(B) The revised interval is narrower than the original interval because the correct sample proportion is closer to 0.5 than the miscalculated proportion is.
(C) The revised interval is wider than the original interval because the correct sample proportion is farther from 0.5 than the miscalculated proportion is.
(D) The revised interval is wider than the original interval because the correct sample proportion is closer to 0.5 than the miscalculated proportion is.
(E) The revised interval has the same width as the original interval.
▶️ Answer/Explanation
The original confidence interval is centered at the sample proportion:
\(\hat{p}=\frac{0.14+0.20}{2}=0.17\)
The corrected sample proportion is \(\hat{p}=0.27\). The standard error for a proportion is based on:
\(\sqrt{\frac{\hat{p}(1-\hat{p})}{n}}\)
Since \(0.27\) is closer to \(0.50\) than \(0.17\), the value of \(\hat{p}(1-\hat{p})\) is larger. A larger standard error produces a larger margin of error, so the revised confidence interval will be wider than the original interval.
✅ Answer: (D)
