
AP Statistics 3.15 Carrying Out a Chi-Square Test for Homogeneity or Independence- Exam Style Questions - FRQs - New Syllabus
Question
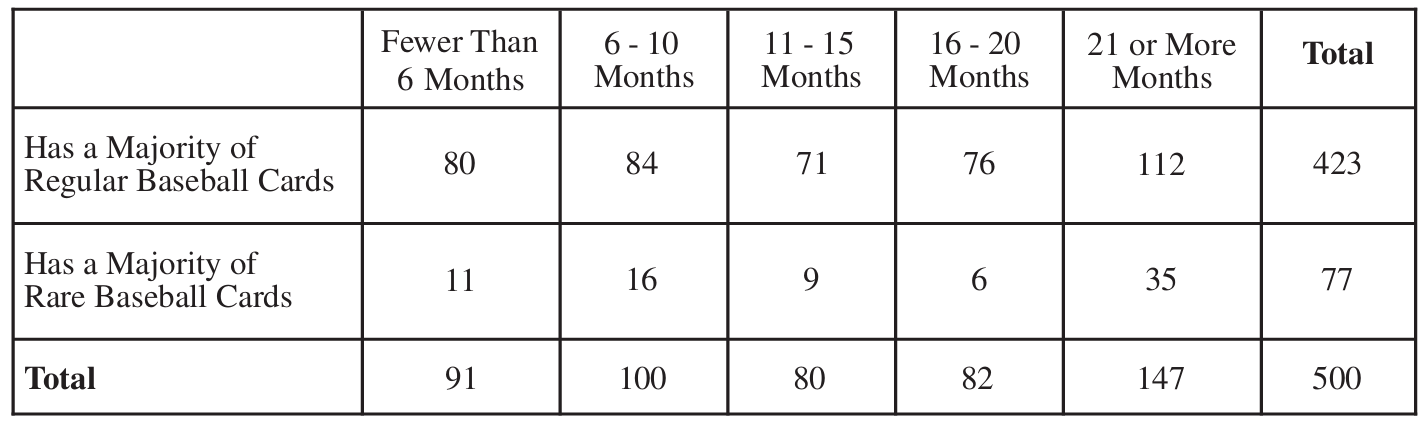
ii. State the appropriate null and alternative hypotheses for the hypothesis test you identified in (c-i). Do not perform the hypothesis test.
Most-appropriate topic codes (AP Statistics):
• Topic \(3.14\) — Setting Up a Chi-Square Test for Homogeneity or Independence (Part \( \mathrm{c} \))
• Topic \(3.15\) — Carrying Out a Chi-Square Test for Homogeneity or Independence (Part \( \mathrm{d} \))
▶️ Answer/Explanation
(a)
To find this probability, we sum the number of collectors who have a majority of regular cards AND have been collecting for \(11\) or more months (which covers the \(11-15\), \(16-20\), and \(21+\) columns).
Number of collectors \(= 71 + 76 + 112 = 259\).
\(P(\ge 11\text{ months and majority regular}) = \dfrac{259}{500} = 0.518\).
(b)
This is a conditional probability. We restrict our focus entirely to the column representing collectors with fewer than \(6\) months of collecting, which gives us a new total of \(91\) collectors.
Out of those \(91\) collectors, \(80\) have a majority of regular baseball cards.
\(P(\text{majority regular} \mid < 6\text{ months}) = \dfrac{80}{91} \approx 0.879\).
(c)
i. Because Michelle took a single random sample and is comparing two categorical variables from that single sample, she should use a chi-square test for independence.
ii. Null Hypothesis (\(H_0\)): There is no association between the number of months spent collecting baseball cards and majority card status for all baseball card collectors at the convention.
Alternative Hypothesis (\(H_a\)): There is an association between the number of months spent collecting baseball cards and majority card status for all baseball card collectors at the convention.
(d)
Because the \(p\)-value of \(0.0075\) is smaller than any reasonable significance level (such as \(\alpha = 0.05\)), Michelle should reject the null hypothesis.
The data provide convincing statistical evidence that there is a relationship between the number of months spent collecting baseball cards and which type of card is the majority in the collection for all baseball card collectors at the convention.
Question
Most-appropriate topic codes (AP Statistics):
• Topic \(3.15\) — Carrying Out a Chi-Square Test for Homogeneity or Independence (Entire Question)
▶️ Answer/Explanation
Step 1: State the Hypotheses
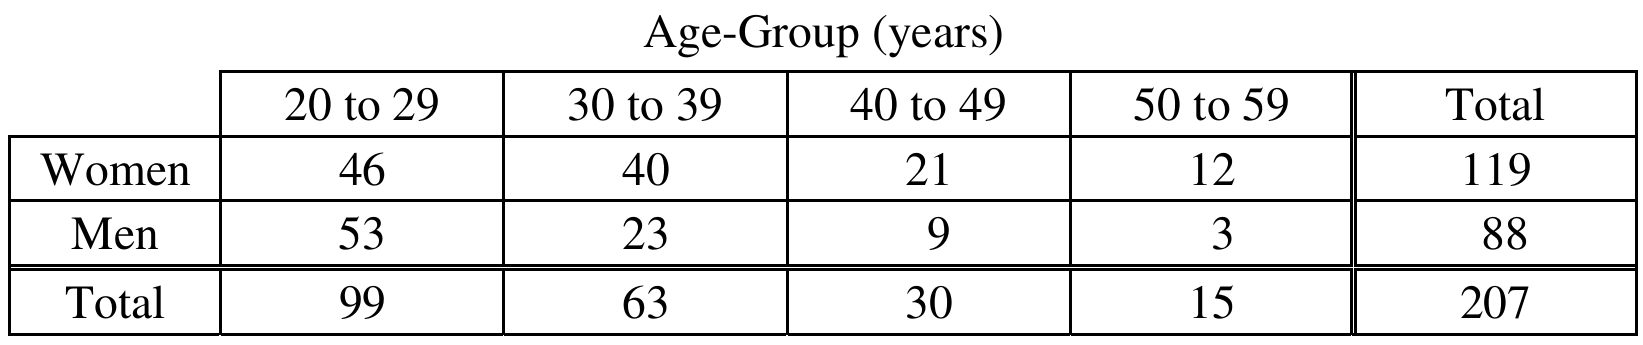
\(H_0\): Age group at diagnosis and gender are independent (not associated) in the population of people currently being treated for schizophrenia.
\(H_a\): Age group at diagnosis and gender are not independent (i.e., there is an association) in the population of people currently being treated for schizophrenia.
Step 2: Identify the Test and Check Conditions
The appropriate test is a chi-square test of independence.
The formula for the test statistic is:
\( \chi^2 = \sum \dfrac{(O – E)^2}{E} \Blocks\
Condition 1 — Random Sample: The problem states the sample was randomly selected.
Condition 2 — Large Expected Counts: All expected cell counts must be at least 5. The expected count for each cell is computed as:
\( E = \dfrac{(\text{row total}) \times (\text{column total})}{\text{grand total}} \)
The full table of expected counts (shown below observed counts) is:
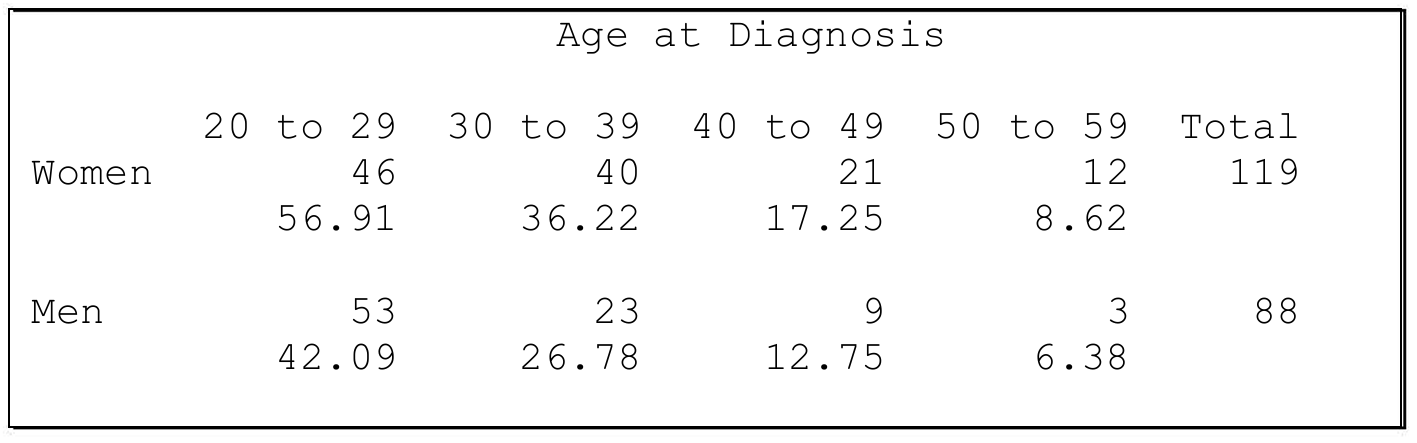
All eight expected counts are at least 5, so the condition is satisfied.
Step 3: Calculate the Test Statistic and \(p\)-value
The degrees of freedom are:
\( df = (\text{rows} – 1)(\text{columns} – 1) = (2-1)(4-1) = 3 \)
The chi-square statistic is:
\( \chi^2 = \dfrac{(46-56.91)^2}{56.91} + \dfrac{(40-36.22)^2}{36.22} + \dfrac{(21-17.25)^2}{17.25} + \dfrac{(12-8.62)^2}{8.62} \)
\( \quad\quad + \dfrac{(53-42.09)^2}{42.09} + \dfrac{(23-26.78)^2}{26.78} + \dfrac{(9-12.75)^2}{12.75} + \dfrac{(3-6.38)^2}{6.38} \)
\( \chi^2 = 2.093 + 0.395 + 0.817 + 1.322 + 2.830 + 0.534 + 1.105 + 1.788 \)
\( \boxed{\chi^2 = 10.884} \)
The \(p\)-value is:
\( p\text{-value} = P(\chi^2 \geq 10.884) = 0.012 \quad \text{with } df = 3 \)
Step 4: State the Conclusion in Context
Since the \(p\)-value of \(0.012\) is less than the significance level \(\alpha = 0.05\), we reject \(H_0\).
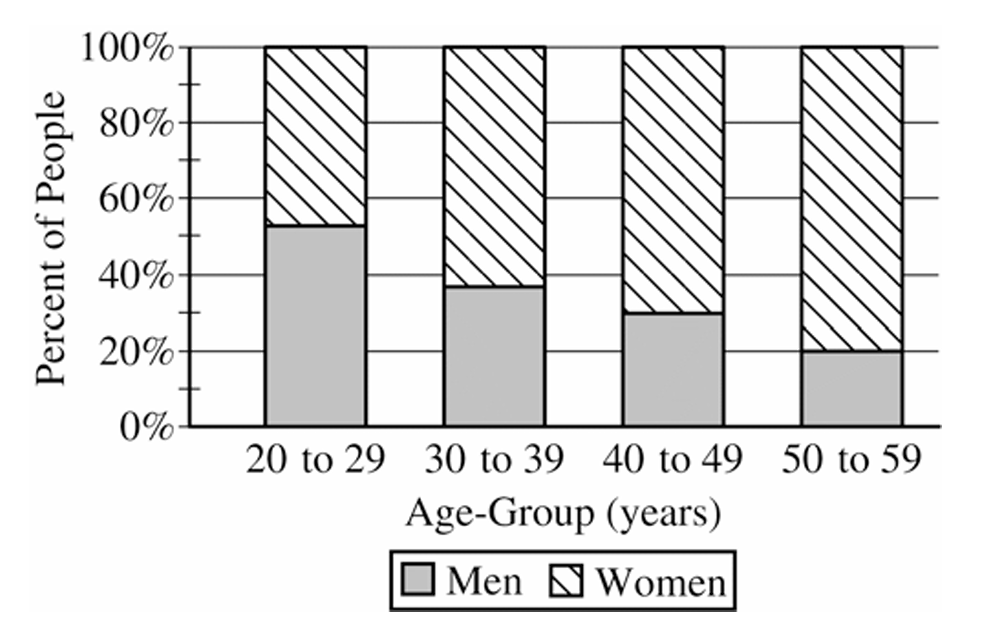
The data provide convincing statistical evidence that there is an association between age group at diagnosis and gender in the population of people currently being treated for schizophrenia. In plain terms, men and women tend to be diagnosed at different ages — men are more concentrated in the 20–29 age group relative to what we’d expect if there were no relationship, while women are more spread across older age groups.
Question
Most-appropriate topic codes (AP Statistics):
• Topic \(3.14\) — Setting Up a Chi-Square Test for Homogeneity or Independence (Part \( \mathrm{a} \))
• Topic \(3.15\) — Carrying Out a Chi-Square Test for Homogeneity or Independence (Part \( \mathrm{a} \))
▶️ Answer/Explanation
(a)
Step 1: State hypotheses.
\(H_0\): There is no association between the type of ad viewed and children’s choice of snack (the proportion choosing each snack is the same regardless of which ad is viewed).
\(H_a\): There is an association between the type of ad viewed and children’s choice of snack (the proportions differ based on which ad is viewed).
Step 2: Identify the procedure and check conditions.
The appropriate procedure is a chi-square test of homogeneity (also acceptable: chi-square test of independence).
Conditions:
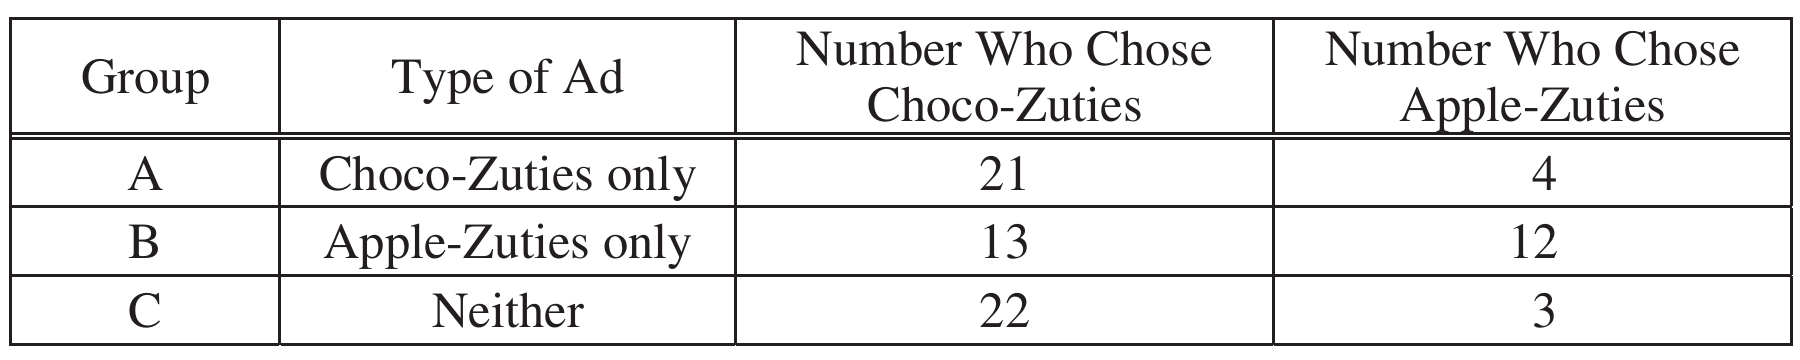
1. Random: The 75 children were randomly assigned to the three groups — this condition is satisfied.
2. Large Counts: All expected cell counts must be at least 5. The expected counts are computed as:
\( E = \frac{(\text{row total}) \times (\text{column total})}{\text{table total}} \)
Expected counts table (observed counts with expected counts in parentheses):

The smallest expected count is \(6.33 \geq 5\), so the large counts condition is satisfied. Both conditions are met.
Step 3: Calculate the test statistic and \(p\)-value.
The chi-square test statistic is:
\( \chi^2 = \sum \frac{(O – E)^2}{E} \)
\( \chi^2 \approx \frac{(21-18.67)^2}{18.67} + \frac{(4-6.33)^2}{6.33} + \frac{(13-18.67)^2}{18.67} + \frac{(12-6.33)^2}{6.33} + \frac{(22-18.67)^2}{18.67} + \frac{(3-6.33)^2}{6.33} \)
\( \chi^2 \approx 0.292 + 0.860 + 1.720 + 5.070 + 0.595 + 1.754 \approx 10.291 \)
Degrees of freedom: \(df = (r-1)(c-1) = (3-1)(2-1) = 2\)
The \(p\)-value: \(P\!\left(\chi^2_{\,df=2} \geq 10.291\right) \approx 0.006\)
Step 4: State a conclusion in context.
Because the \(p\)-value \(\approx 0.006\) is much smaller than \(\alpha = 0.05\), we reject \(H_0\). The data provide convincing statistical evidence that there is an association between the type of ad viewed and children’s choice of snack, among all children similar to those who participated in the experiment.
(b)
When neither ad was shown (Group C), \(\dfrac{22}{25} = 88\%\) of the children chose Choco-Zuties, and only 12% chose Apple-Zuties — this reflects the baseline preference without any advertising.
When children saw the Choco-Zuties ad (Group A), 84% still chose Choco-Zuties, which is very close to the 88% in the no-ad group. So the Choco-Zuties ad had very little effect on children’s snack choice — they were already inclined toward the sugary option anyway.
When children saw the Apple-Zuties ad (Group B), only \(\dfrac{13}{25} = 52\%\) chose Choco-Zuties, and 48% chose Apple-Zuties. This is a large shift compared to the 12% who chose Apple-Zuties in the no-ad group, meaning the Apple-Zuties ad had a substantial effect in increasing children’s likelihood of choosing the healthy snack.
Question
- Are you an on campus student or an off campus student?
- In how many extracurricular activities do you participate?
\(H_0\): There is no association between residential status and level of participation in extracurricular activities among the students at the university.
\(H_a\): There is an association between residential status and level of participation in extracurricular activities among the students at the university.
Most-appropriate topic codes (AP Statistics):
• Topic \(3.14\) — Setting Up a Chi-Square Test for Homogeneity or Independence (Part \( \mathrm{c} \))
• Topic \(3.15\) — Carrying Out a Chi-Square Test for Homogeneity or Independence (Part \( \mathrm{c} \))
▶️ Answer/Explanation
(a)
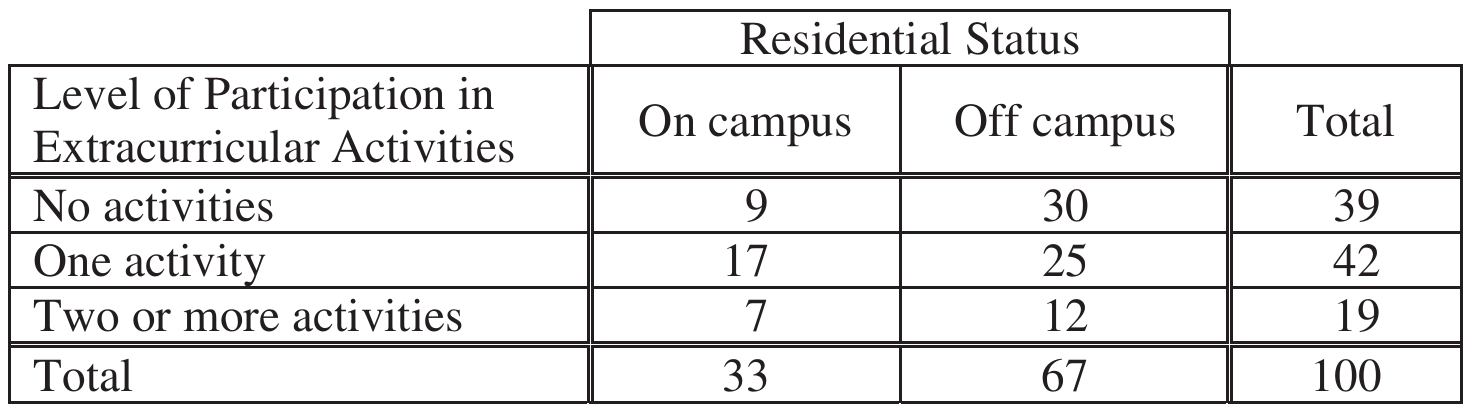
For on campus students, “at least one activity” means one activity or two or more activities, so we add those counts and divide by the total number of on campus students:
\(\hat{p}_{\text{on}} = \dfrac{17 + 7}{33} = \dfrac{24}{33} \approx 0.727\)
For off campus students, we do the same:
\(\hat{p}_{\text{off}} = \dfrac{25 + 12}{67} = \dfrac{37}{67} \approx 0.552\)
\(\boxed{\hat{p}_{\text{on}} \approx 0.727, \quad \hat{p}_{\text{off}} \approx 0.552}\)
(b)
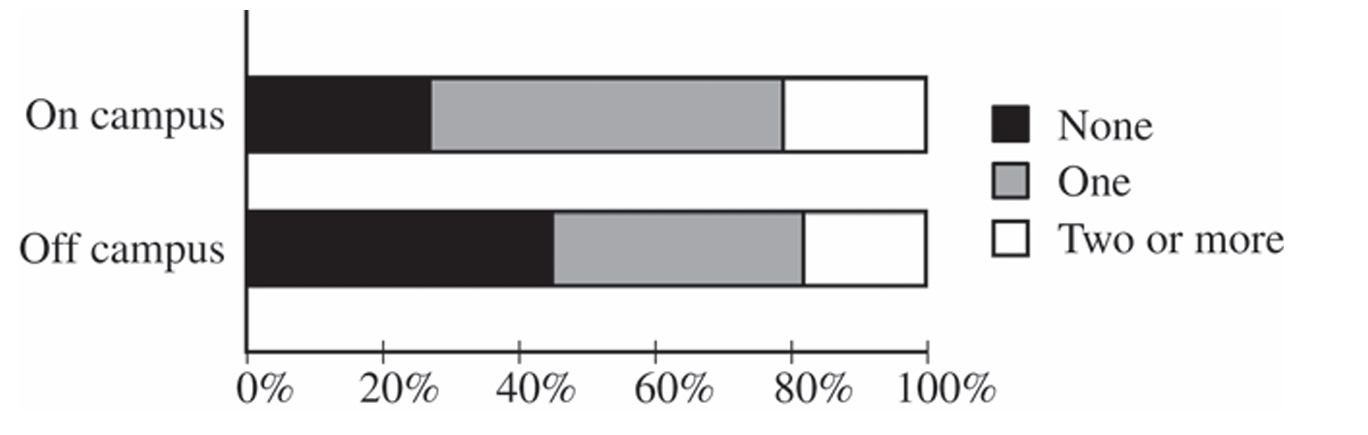
Looking at the segmented bar graph, on campus residents appear more likely to participate in extracurricular activities than off campus residents. Specifically, on campus students have a higher proportion participating in one activity (about \(51.5\%\) vs. \(37.3\%\)) and a lower proportion participating in no activities (about \(27.3\%\) vs. \(44.8\%\)). The proportions participating in two or more activities are fairly similar between the two groups (on campus: \(\approx 21.2\%\), off campus: \(\approx 17.9\%\)).
(c)
The \(p\)-value of \(0.23\) is greater than conventional significance levels such as \(\alpha = 0.05\) or \(\alpha = 0.10\). Because the \(p\)-value is large, we fail to reject the null hypothesis \(H_0\).
The sample data do not provide sufficient evidence to conclude that there is an association between residential status and level of participation in extracurricular activities among all students at the university.
Question
Most-appropriate topic codes (AP Statistics):
• Topic \(3.15\) — Carrying Out a Chi-Square Test for Homogeneity or Independence (Step 3, Step 4)
▶️ Answer/Explanation
Step 1: State the hypotheses.
\(H_0\): There is no association between age group and whether or not a person consumes five or more servings of fruits and vegetables per day for adults in the United States (i.e., the two variables are independent).
\(H_a\): There is an association between age group and whether or not a person consumes five or more servings of fruits and vegetables per day for adults in the United States (i.e., the two variables are not independent).
Step 2: Identify the procedure and check conditions.
The appropriate test is a chi-square test of independence, with test statistic:
$\chi^2 = \sum \frac{(O – E)^2}{E}$
where the expected count for each cell is computed as:
$E = \frac{(\text{row total}) \times (\text{column total})}{\text{table total}}$
Condition 1 — Random sample: The problem states that the sample was randomly selected.
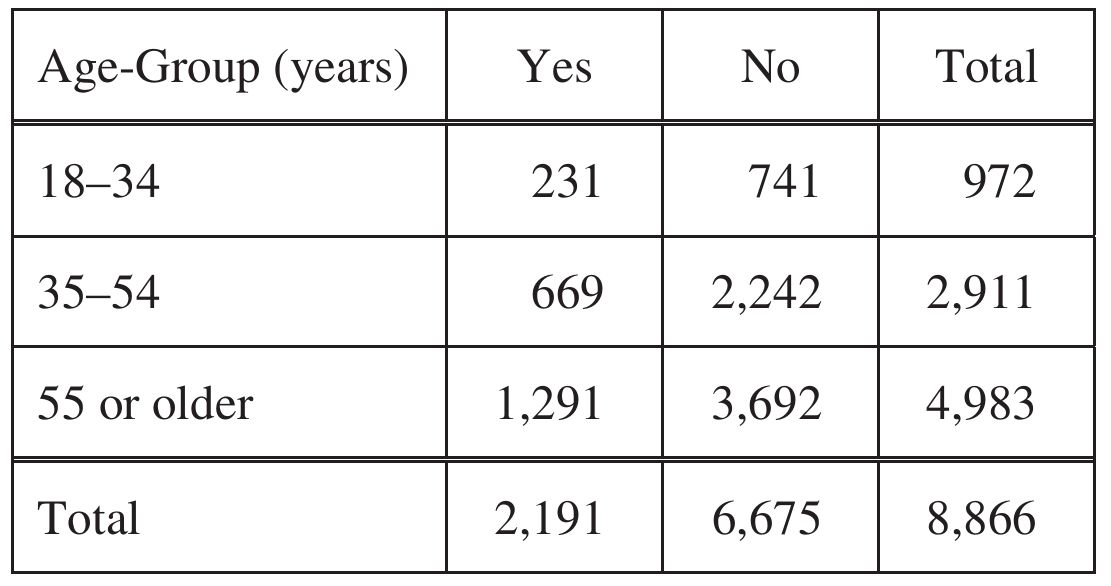
Condition 2 — Expected counts: All six expected counts are at least \(5\), as shown below:
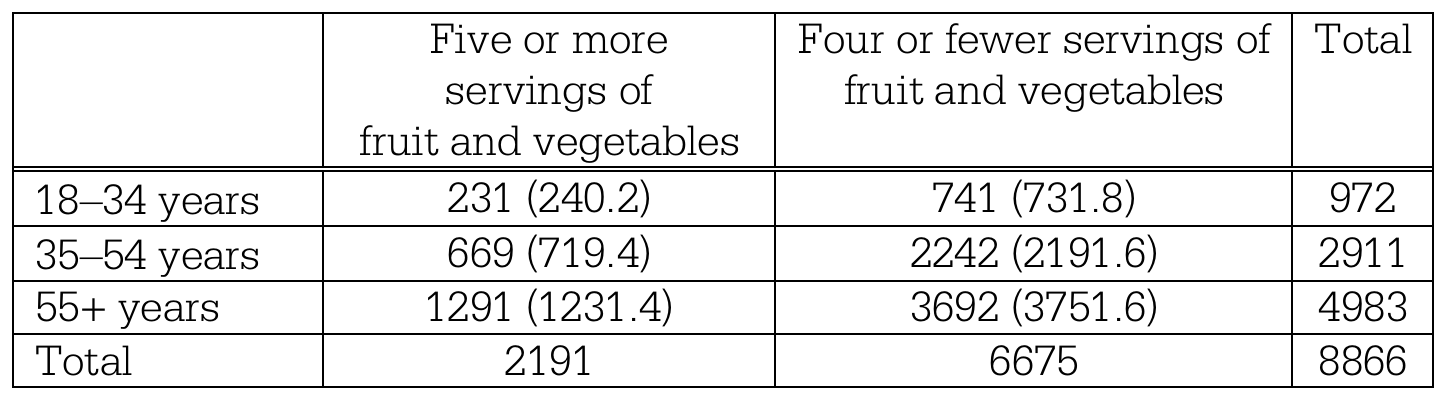
The smallest expected count is \(240.2 \geq 5\).
Step 3: Compute the test statistic and \(p\)-value.
Degrees of freedom: \(df = (3-1)(2-1) = 2\)
$\chi^2 = \frac{(231-240.2)^2}{240.2} + \frac{(741-731.8)^2}{731.8} + \frac{(669-719.4)^2}{719.4} + \frac{(2242-2191.6)^2}{2191.6} + \frac{(1291-1231.4)^2}{1231.4} + \frac{(3692-3751.6)^2}{3751.6}$
$\chi^2 = 0.353 + 0.116 + 3.528 + 1.158 + 2.883 + 0.946$
$\boxed{\chi^2 = 8.983}$
$\boxed{p\text{-value} = P(\chi^2 \geq 8.983) \approx 0.011}$
Step 4: State the conclusion in context.
Since the \(p\)-value of \(0.011\) is less than \(\alpha = 0.05\), we reject \(H_0\). The data provide convincing statistical evidence that there is an association between age group and whether or not a person consumes five or more servings of fruits and vegetables per day for adults in the United States. In particular, adults aged 55 or older were more likely to consume five or more servings per day, while middle-aged adults (35–54 years) were less likely to do so relative to what would be expected under independence.
Question
Most-appropriate topic codes (AP Statistics):
• Topic 3.15 — Carrying Out a Chi-Square Test for Homogeneity or Independence (Part b)
• Topic 3.15 — Carrying Out a Chi-Square Test for Homogeneity or Independence (Part c)
• Topic 3.8 — Potential Errors When Performing Tests (Part d)
▶️ Answer/Explanation
(a)
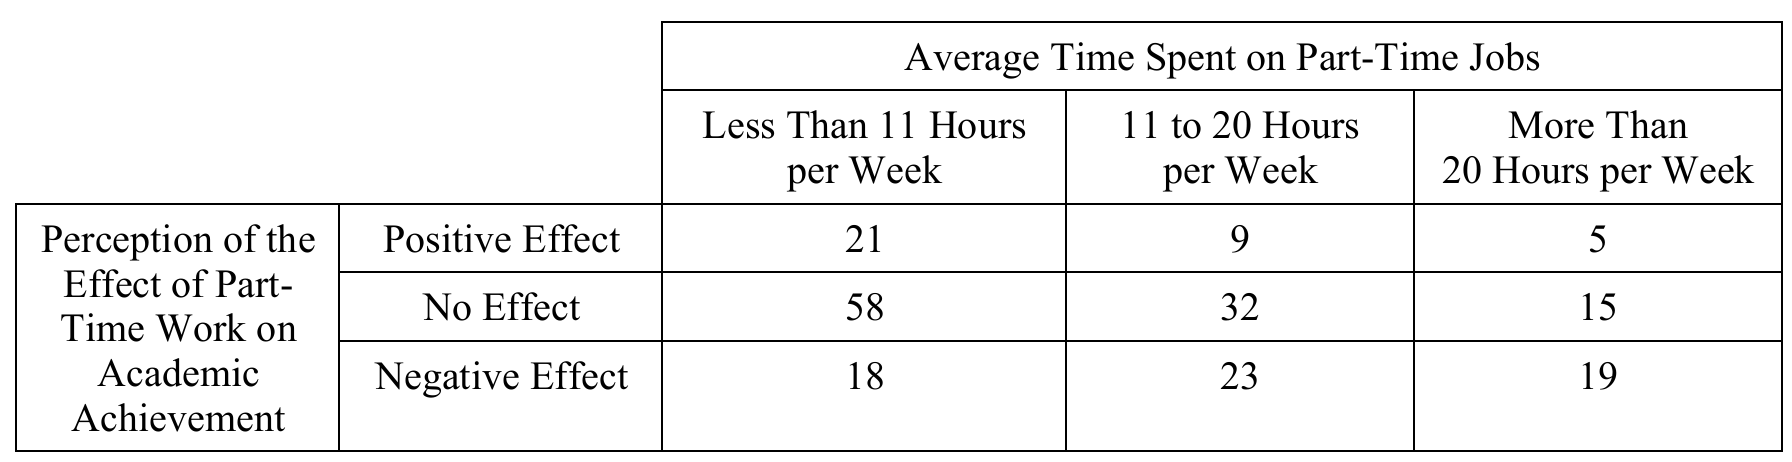
\(H_0\): There is no association between the perceived effect of part-time work on academic achievement and the average time spent on part-time jobs.
\(H_a\): There is an association between the perceived effect of part-time work on academic achievement and the average time spent on part-time jobs.
(b)
The conditions for a chi-square inference procedure are met for these data:
1. Randomization: The problem states that the advisory board surveyed a “simple random sample” of students, so the random condition is met.
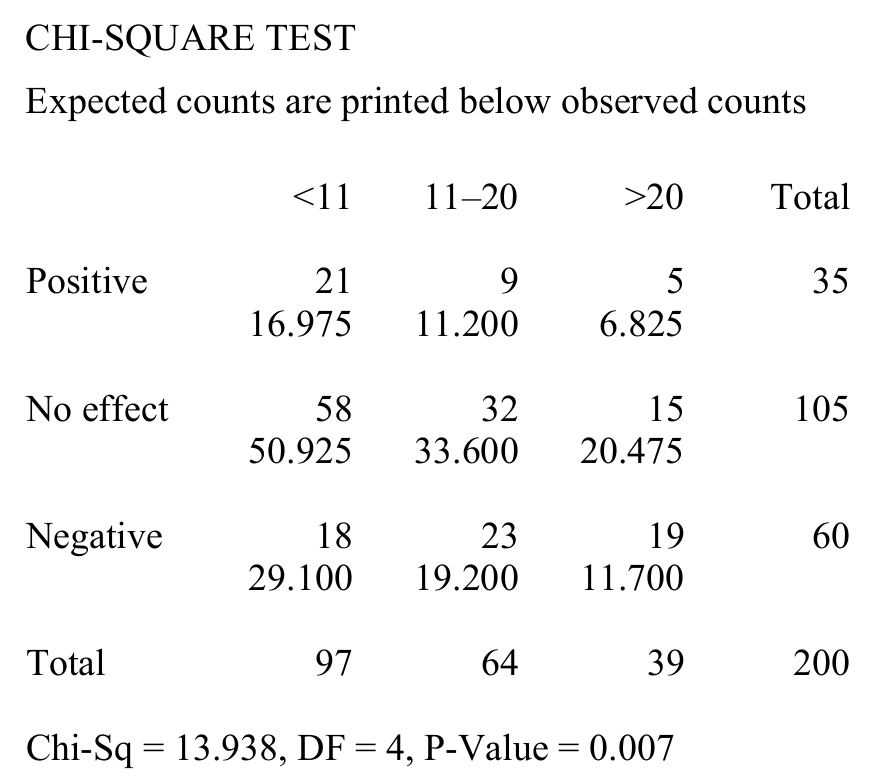
2. Expected Counts: All expected cell counts must be at least \(5\). Looking at the provided computer output, the expected counts (printed below the observed counts) are all greater than \(5\). The smallest expected count is \(6.825\), so this condition is met.
(c)
Because the \(p\)-value of \(0.007\) is less than standard significance levels (like \(\alpha = 0.05\)), we reject the null hypothesis.
The advisory board should conclude that there is convincing statistical evidence of an association between a student’s perceived effect of part-time work on academic achievement and the average number of hours per week that the student works.
(d)
Because the null hypothesis was rejected in part (c), the advisory board might have made a Type I error.
In the context of the question, a Type I error would be concluding that there is an association between the perceived effect of part-time work on academic achievement and the average time spent on part-time jobs when, in reality, there is no such association between these two variables.
Question
\(H_a\): There is a difference in the distributions of hurricane damage amounts among the three regions.
Most-appropriate topic codes (AP Statistics):
• Topic 2.8 — Introduction to Random Variables and Probability Distributions (Part c)
• Topic 3.15 — Carrying Out a Chi-Square Test for Homogeneity or Independence (Parts d, e)
▶️ Answer/Explanation
(a) Graphical Display
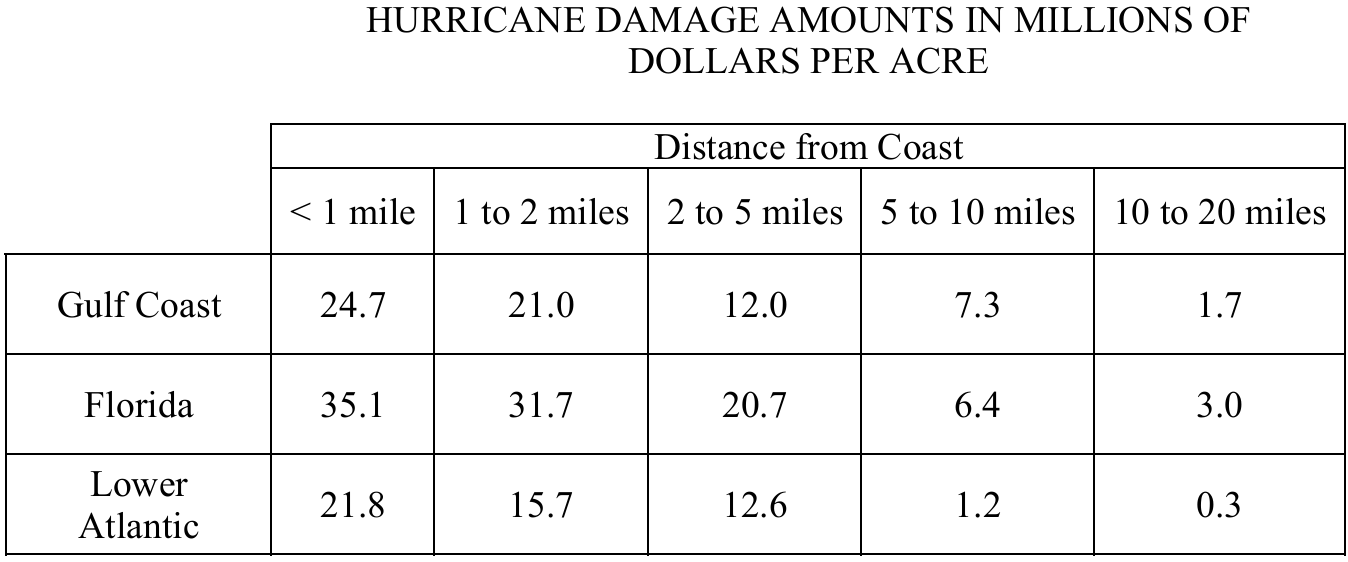
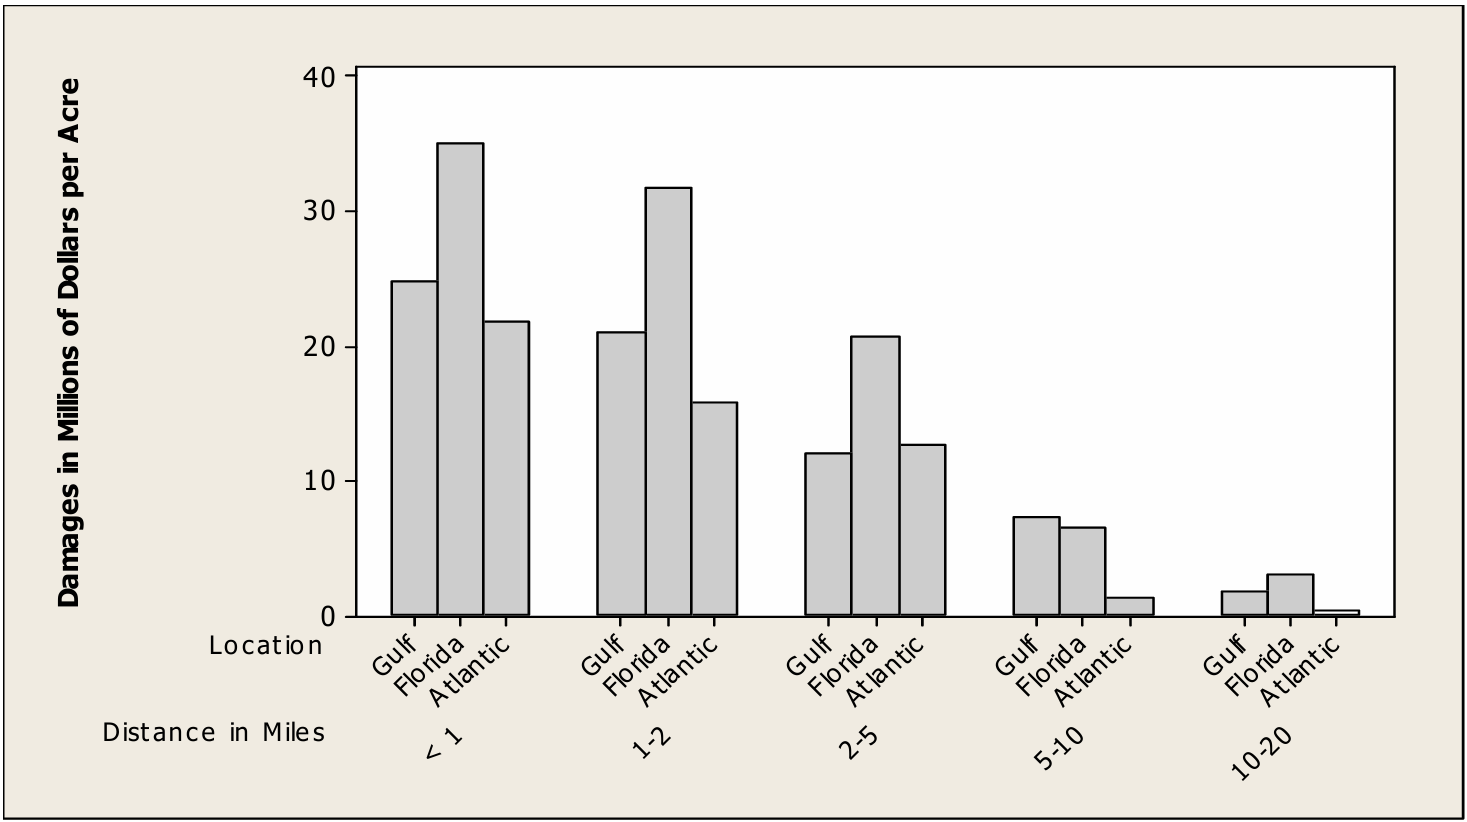
A well-constructed graphical display for this data is a grouped bar chart, with the five distance-from-coast categories on the horizontal axis and damage amounts (in millions of dollars per acre) on the vertical axis. Three bars are drawn side by side within each distance group — one for Gulf Coast, one for Florida, and one for Lower Atlantic — with a clearly labeled key.
(b) Differences and Similarities
Similarity: In all three regions, hurricane damage amounts decrease consistently as distance from the coast increases. This pattern holds without exception across all five distance categories for every region.
Difference: For almost every distance category, Florida has the highest damage amounts, while the Lower Atlantic region generally has the lowest. The Gulf Coast falls in between, though at the 5-to-10-mile distance, the Gulf Coast actually has the highest damage of the three regions.
(c) Missing Ranks and Average Ranks
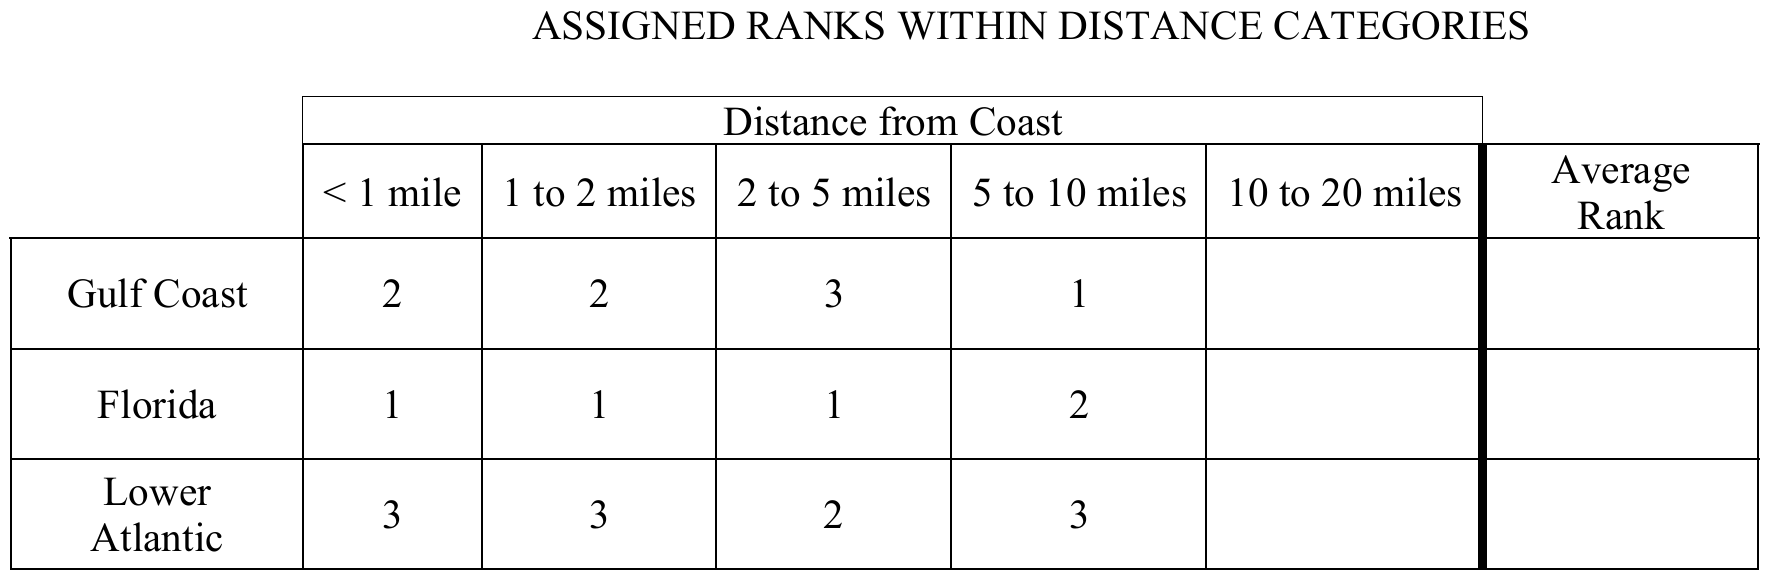
For the 10-to-20-miles distance category, compare the three damage amounts:
Florida: \(3.0\) million (highest) \(\Rightarrow\) rank \(= 1\)
Gulf Coast: \(1.7\) million (middle) \(\Rightarrow\) rank \(= 2\)
Lower Atlantic: \(0.3\) million (lowest) \(\Rightarrow\) rank \(= 3\)
The completed rank table is:

The average ranks are computed as follows:
\(\bar{R}_G = \frac{2+2+3+1+2}{5} = \frac{10}{5} = 2.0\)
\(\bar{R}_F = \frac{1+1+1+2+1}{5} = \frac{6}{5} = 1.2\)
\(\bar{R}_A = \frac{3+3+2+3+3}{5} = \frac{14}{5} = 2.8\)
(d) Calculating the Test Statistic \(Q\)
Substitute the average ranks from part (c) into the formula:
\(Q = 5\left[\left(\bar{R}_G – 2\right)^2 + \left(\bar{R}_F – 2\right)^2 + \left(\bar{R}_A – 2\right)^2\right]\)
\(Q = 5\left[(2.0 – 2)^2 + (1.2 – 2)^2 + (2.8 – 2)^2\right]\)
\(Q = 5\left[0 + (-0.8)^2 + (0.8)^2\right]\)
\(Q = 5\left[0 + 0.64 + 0.64\right]\)
\(\boxed{Q = 5 \times 1.28 = 6.4}\)
(e) Simulation-Based Conclusion
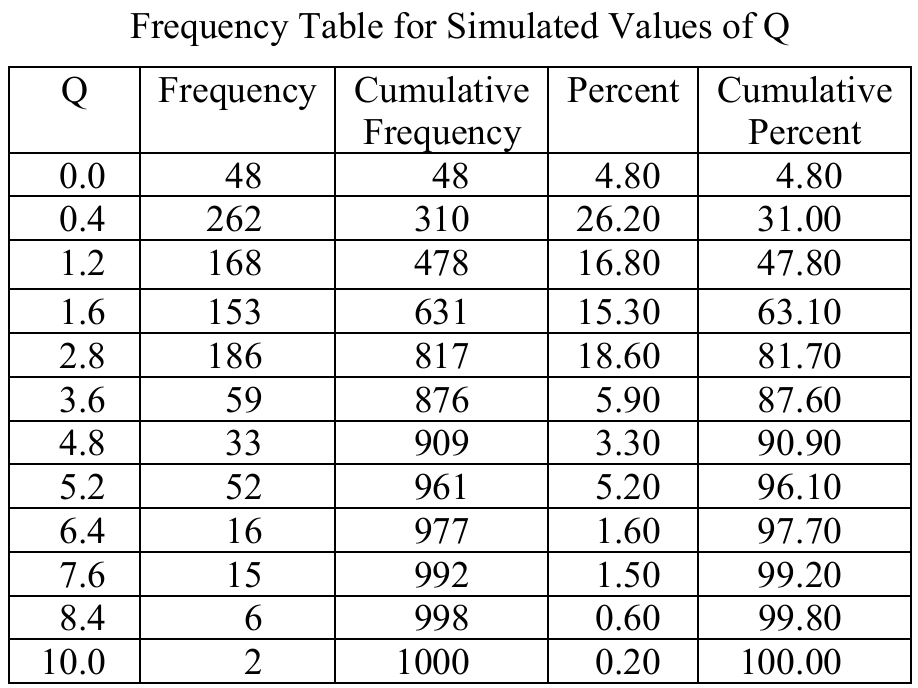
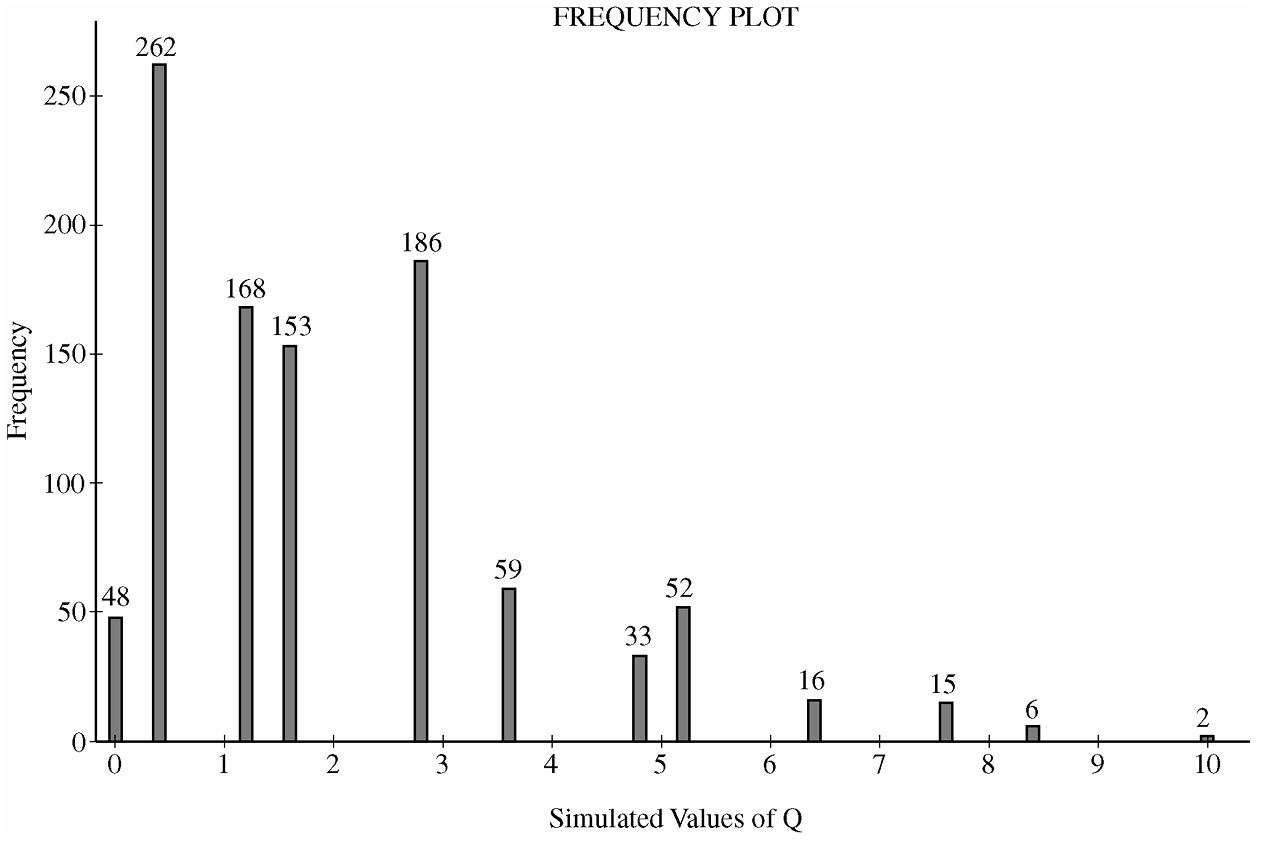
From the frequency table, simulated \(Q\) values of \(6.4\) or greater occurred in:
\(16 + 15 + 6 + 2 = 39 \text{ out of } 1{,}000 \text{ simulations}\)
This gives an approximate \(p\)-value of:
\(p\text{-value} \approx \frac{39}{1{,}000} = 0.039\)
Since the \(p\)-value of \(0.039\) is less than \(\alpha = 0.05\), we reject \(H_0\). The sample data provide reasonably strong evidence that there is a difference in the distributions of hurricane damage amounts among the three coastal regions (Gulf Coast, Florida, and Lower Atlantic).
Question
Most-appropriate topic codes (AP Statistics):
• Topic 3.15 — Carrying Out a Chi-Square Test for Homogeneity or Independence (Parts \(\mathrm{a}\), \(\mathrm{b}\))
▶️ Answer/Explanation
(a)
Step 1 — Hypotheses
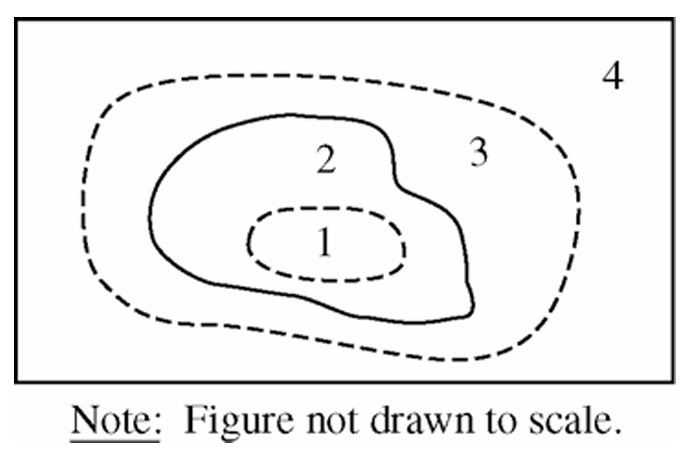
\(H_0\): The number of moose in each habitat type is proportional to the amount of acreage of that habitat type (moose have no preference for any particular habitat).
\(H_a\): The number of moose in at least one habitat type is not proportional to the acreage of that type (moose show a preference for at least one habitat type).
Step 2 — Test and Conditions
We use a chi-square goodness-of-fit test, with test statistic
\(\chi^2 = \displaystyle\sum \frac{(\text{Observed} – \text{Expected})^2}{\text{Expected}}\)
The conditions for inference are stated to be met.
Step 3 — Expected Counts and Test Statistic
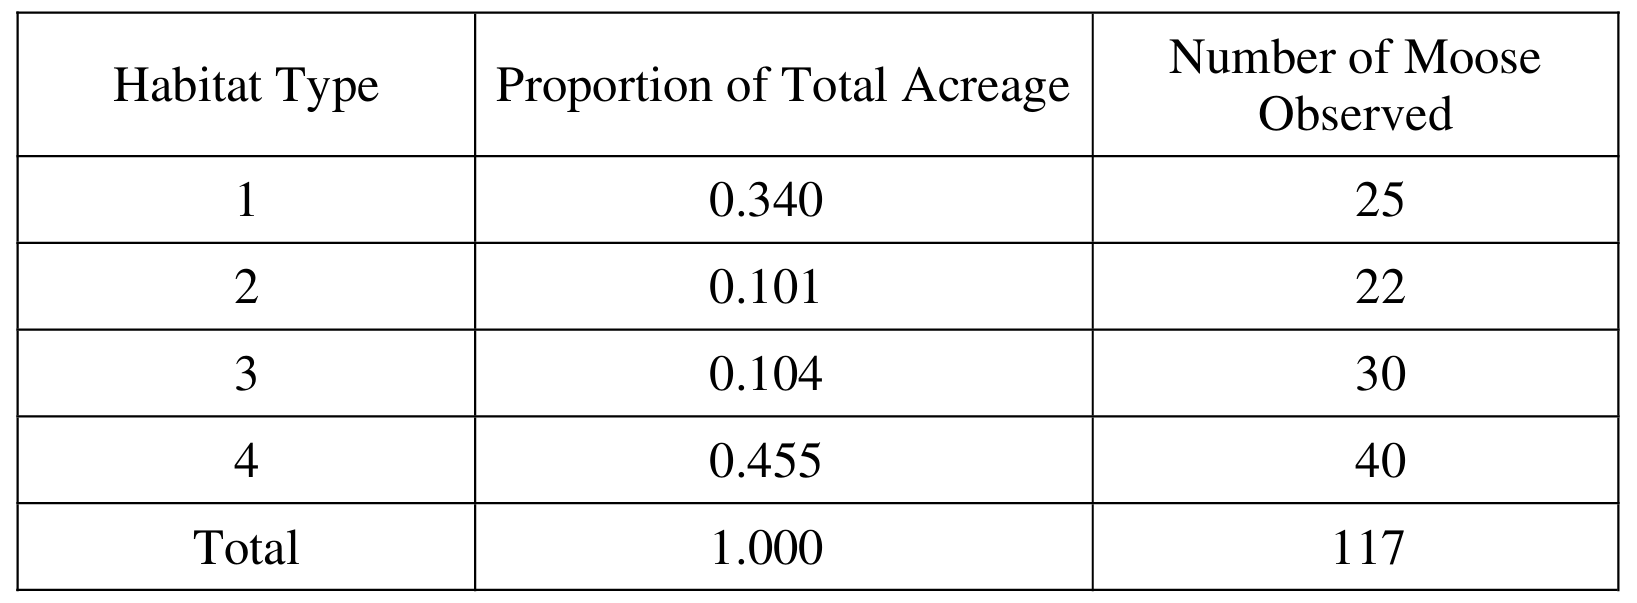
The expected count for each habitat type is found by multiplying the total number of moose (117) by the proportion of total acreage:
\(E_1 = 0.340 \times 117 = 39.780\)
\(E_2 = 0.101 \times 117 = 11.817\)
\(E_3 = 0.104 \times 117 = 12.168\)
\(E_4 = 0.455 \times 117 = 53.235\)
The chi-square test statistic is:
\(\chi^2 = \dfrac{(25 – 39.780)^2}{39.780} + \dfrac{(22 – 11.817)^2}{11.817} + \dfrac{(30 – 12.168)^2}{12.168} + \dfrac{(40 – 53.235)^2}{53.235}\)
\(\chi^2 = \dfrac{(-14.780)^2}{39.780} + \dfrac{(10.183)^2}{11.817} + \dfrac{(17.832)^2}{12.168} + \dfrac{(-13.235)^2}{53.235}\)
\(\chi^2 = 5.491 + 8.775 + 26.133 + 3.290 = \boxed{43.689}\)
Degrees of freedom: \(\,df = 4 – 1 = 3\)
\(p\text{-value} = P(\chi^2_3 \geq 43.689) \approx 1.757 \times 10^{-9} \ll 0.05\)
Step 4 — Conclusion
Since the \(p\)-value is essentially zero and far below any conventional significance level (\(\alpha = 0.05\)), we reject \(H_0\). There is very strong evidence that the number of moose in each habitat type is not proportional to the acreage of that habitat, meaning moose show a statistically significant preference for certain habitat types.
(b)
The moose seem to prefer habitat types 2 and 3. Relative to the proportion of total acreage, a higher proportion of moose were observed in each of these habitat types than expected. In habitat types 1 and 4, the observed proportion of moose was less than the expected proportion of moose, indicating that these two habitat types are less desirable.
Question
Most-appropriate topic codes (AP Statistics):
• Topic 3.15 — Carrying Out a Chi-Square Test for Homogeneity or Independence (Part a)
• Topic 3.1 — Estimators (Part b)
• Topic 1.11 — Random Sampling (Part b)
▶️ Answer/Explanation
(a)
The appropriate procedure is a chi-square test for independence.
Hypotheses:
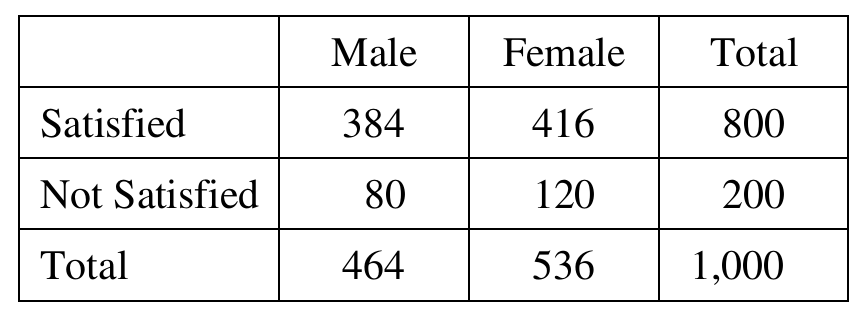
\(H_0\): Gender and satisfaction with hospital services are independent (no association).
\(H_a\): Gender and satisfaction with hospital services are not independent (there is an association)
Conditions:
— The sample is a random sample of 1,000 adult county residents.
— All expected cell counts must be at least 5.
Compute each:
\(E = \frac{(\text{row total})(\text{column total})}{\text{grand total}}\)
\(E(\text{Satisfied, Male}) = \dfrac{800 \times 464}{1000} = 371.2\)
\(E(\text{Satisfied, Female}) = \dfrac{800 \times 536}{1000} = 428.8\)
\(E(\text{Not Satisfied, Male}) = \dfrac{200 \times 464}{1000} = 92.8\)
\(E(\text{Not Satisfied, Female}) = \dfrac{200 \times 536}{1000} = 107.2\)
All expected counts are well above 5.
Test Statistic:
\(\chi^2 = \sum \frac{(O – E)^2}{E}\)
\(\chi^2 = \frac{(384 – 371.2)^2}{371.2} + \frac{(416 – 428.8)^2}{428.8} + \frac{(80 – 92.8)^2}{92.8} + \frac{(120 – 107.2)^2}{107.2}\)
\(\chi^2 = \frac{(12.8)^2}{371.2} + \frac{(-12.8)^2}{428.8} + \frac{(-12.8)^2}{92.8} + \frac{(12.8)^2}{107.2}\)
\(\chi^2 = 0.4413 + 0.3821 + 1.7655 + 1.5284 = 4.117\)
Degrees of freedom:
\(df = (r-1)(c-1) = (2-1)(2-1) = 1\)
P-value:
Using the \(\chi^2\) distribution with \(df = 1\):
\(p\text{-value} \approx 0.0424\)
Conclusion:
Since \(p\text{-value} = 0.0424 < \alpha = 0.05\), we reject \(H_0\). There is sufficient statistical evidence at the \(0.05\) significance level to conclude that there is an association between gender and satisfaction with hospital services for adult residents of this county.
\(\boxed{\chi^2 = 4.117,\quad df = 1,\quad p\text{-value} \approx 0.0424 \Rightarrow \text{Reject } H_0}\)
(b)
Yes, \(\dfrac{800}{1{,}000} = 0.80\) is a reasonable estimate for the proportion of all adult county residents who are satisfied with hospital services. The data were collected from a random sample of 1,000 adult county residents, which means the sample is likely representative of the population of all adult county residents. Because random sampling was used, the sample proportion \(\hat{p} = 0.80\) is an unbiased estimate of the true population proportion. Additionally, with a sample size of \(n = 1{,}000\), the estimate is based on a sufficiently large and randomly selected group, giving us reasonable confidence in its accuracy.
\(\boxed{\hat{p} = \frac{800}{1{,}000} = 0.80 \text{ is a reasonable estimate (random sample, large } n\text{)}}\)
Question
Most-appropriate topic codes (AP Statistics):
• Topic 3.15 — Carrying Out a Chi-Square Test for Homogeneity or Independence (Whole Question)
▶️ Answer/Explanation
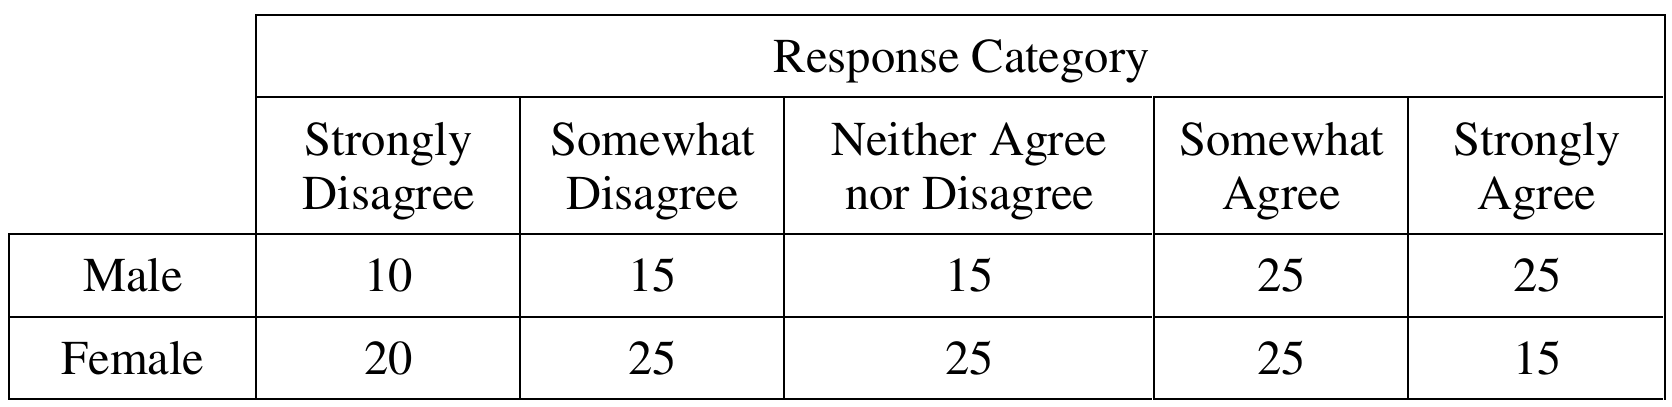
This problem is asking whether two categorical variables — gender and opinion category — are related to each other, which calls for a Chi-Square test for independence.
State the hypotheses:
\( H_0: \) Response and gender are independent (there is no association between response and gender)
\( H_a: \) Response and gender are not independent (there is an association between response and gender)
Check the conditions:
The \(200\) students were randomly sampled, so the random condition is satisfied. To check the large sample size condition, we need the expected count for each cell, found using:
\( \text{Expected count}=\dfrac{(\text{row total})(\text{column total})}{\text{grand total}} \)
Computing each row and column total, then applying this formula to all \(10\) cells gives:

All of these expected counts are well above \(5\), so the sample size is large enough for the Chi-Square test to be valid.
Compute the test statistic:
The Chi-Square statistic compares each observed count to its expected count:
\( \chi^2=\sum\dfrac{(\text{Observed}-\text{Expected})^2}{\text{Expected}} \)
Adding up this quantity across all \(10\) cells:
\( \chi^2\approx0.907+0.500+0.500+0.278+2.722+0.742+0.409+0.409+0.227+2.227 \)
\( \chi^2\approx8.921 \)
The degrees of freedom for a table with \(2\) rows and \(5\) columns is:
\( df=(2-1)(5-1)=4 \)
Using \(\chi^2\approx8.921\) with \(df=4\), the corresponding P-value is approximately:
\( P\text{-value}\approx0.063 \)
State the conclusion:
Since the P-value \((\approx0.063)\) is greater than a standard significance level of \(\alpha=0.05\), we fail to reject \(H_0\).
\( \boxed{\text{There is not sufficient evidence to conclude that response is dependent on gender.}} \)
That said, since the P-value of \(0.063\) is only slightly above \(0.05\), results this extreme would occur by chance alone only about \(6\) times out of \(100\) if gender and response really were independent — so while we don’t reach the standard threshold for significance, this does provide some marginal evidence of an association between gender and response.
Question
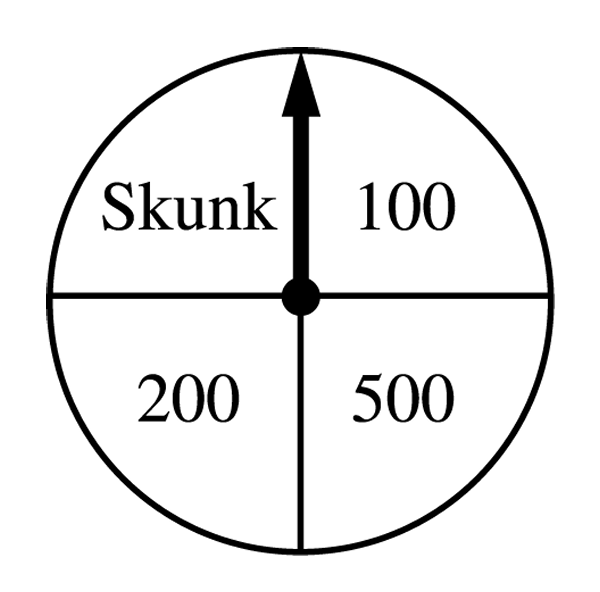
- The contestant spins the wheel.
- If the result is a skunk, no money is won and the contestant’s turn is finished.
- If the result is a number, the corresponding amount in dollars is won. The contestant can then stop with those winnings or can choose to spin again, and his or her turn continues.
- If the contestant spins again and the result is a skunk, all of the money earned on that turn is lost and the turn ends.
- The contestant may continue adding to his or her winnings until he or she chooses to stop or until a spin results in a skunk.

Most-appropriate topic codes (AP Statistics):
• Topic 2.9 — Parameters of Random Variables (Part b)
• Topic 3.14 — Setting Up a Chi-Square Test for Homogeneity or Independence (Part c)
• Topic 3.15 — Carrying Out a Chi-Square Test for Homogeneity or Independence (Part c)
▶️ Answer/Explanation
(a)
There are four equally likely outcomes on the wheel: Skunk, \(\$100\), \(\$200\), and \(\$500\). So the probability of landing on a number (i.e., not a skunk) on any single spin is \(\dfrac{3}{4}\).
Since spins are independent, the probability of getting a number on all three of the first three spins is:
\( P(\text{number on all 3 spins}) = \left(\frac{3}{4}\right)^3 = \frac{27}{64} \approx 0.4219 \)
\(\boxed{P \approx 0.4219}\)
(b)
The contestant currently has \(\$800\) and chooses to spin a fourth time. The four equally likely outcomes on the fourth spin lead to the following total winnings:
The expected value of total winnings is:
\( E(\text{total winnings}) = 0\left(\frac{1}{4}\right) + 900\left(\frac{1}{4}\right) + 1000\left(\frac{1}{4}\right) + 1300\left(\frac{1}{4}\right) \)
\( = \frac{0 + 900 + 1000 + 1300}{4} = \frac{3200}{4} = \$800 \)
Alternatively, the expected gain from the fourth spin alone is:
\( E(\text{4th spin gain}) = (-800)\left(\frac{1}{4}\right) + 100\left(\frac{1}{4}\right) + 200\left(\frac{1}{4}\right) + 500\left(\frac{1}{4}\right) = \frac{-800+100+200+500}{4} = 0 \)
So the expected total winnings \(= \$800 + \$0 = \boxed{\$800}\).
Interestingly, the expected value of spinning again is exactly equal to the amount already won — so on average the fourth spin neither helps nor hurts.
(c)
Hypotheses:
\( H_0: p_1 = p_2 = p_3 = p_4 = \frac{1}{4} \quad \text{(all four outcomes are equally likely)} \)
\( H_a: \text{at least one } p_i \neq \frac{1}{4} \quad \text{(the four outcomes are not equally likely)} \)
Test: Chi-square goodness-of-fit test.
Conditions: The spins are independent (stated in the problem), and the expected count for each outcome is \(100 \times \frac{1}{4} = 25 > 5\), so the sample size is large enough to proceed.
Expected counts: 25 for each of the four outcomes.
Test statistic:
\( \chi^2 = \sum \frac{(\text{Observed} – \text{Expected})^2}{\text{Expected}} \)
\( = \frac{(33-25)^2}{25} + \frac{(21-25)^2}{25} + \frac{(20-25)^2}{25} + \frac{(26-25)^2}{25} \)
\( = \frac{64}{25} + \frac{16}{25} + \frac{25}{25} + \frac{1}{25} = \frac{106}{25} = 4.24 \)
Degrees of freedom: \(df = 4 – 1 = 3\)
P-value: \(p\text{-value} \approx 0.237\) (from chi-square table with \(df = 3\), the test statistic of 4.24 falls well below the critical value of 7.81 at \(\alpha = 0.05\)).
Conclusion: Since the \(p\text{-value} \approx 0.237 > 0.05\), we fail to reject \(H_0\). There is not convincing statistical evidence that the four outcomes on the wheel are not equally likely — the data are consistent with a fair wheel.