
AP Statistics 3.6 p-Values- Exam Style Questions - MCQs - New Syllabus
Question
(B) Reject \(H_0\); there is convincing evidence that the school proportion is greater than \(0.22\).
(C) Reject \(H_0\); there is convincing evidence that the school proportion is equal to \(0.22\).
(D) Fail to reject \(H_0\); there is convincing evidence that the school proportion is less than \(0.22\).
▶️ Answer/Explanation
The \(p\)-value is approximately \(0.0233\), and the significance level is \(\alpha=0.05\).
Since
\(0.0233<0.05\),
we reject the null hypothesis \(H_0:p=0.22\).
Therefore, there is convincing statistical evidence to support Karen’s belief that the proportion of all students at her school who use the app at least once per week is greater than \(0.22\).
✅ Answer: (B)
Question
A used clothing consignment store advertises that over 80% of their consignors sell over 75% of their consigned items within 3 months. A random sample of 100 consignors was collected. In this sample 87 out of the 100 consignors had sold over 75% of their consigned items within 3 months.
Two students ran the following hypothesis test based on the information provided above.
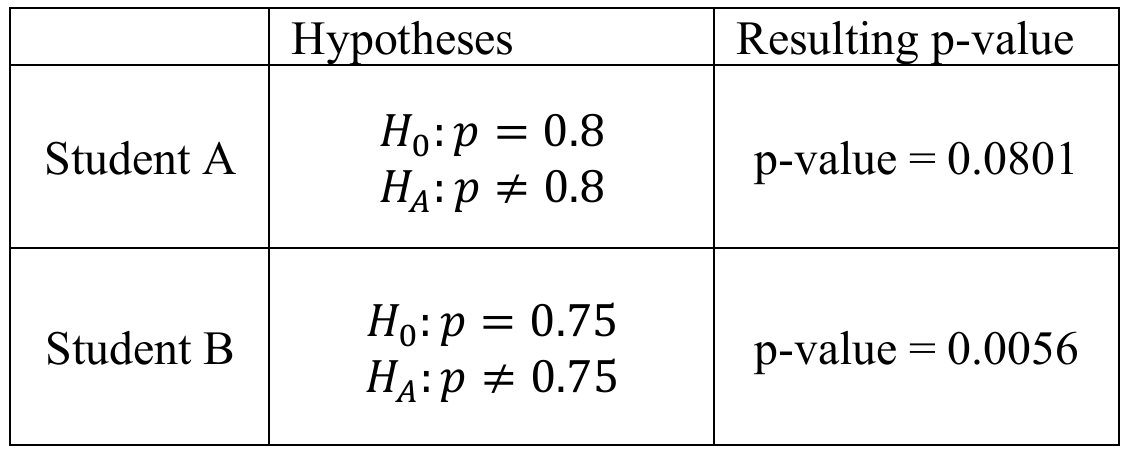
Determine if there is statistical evidence at the alpha = 0.05 level of significance to support the stores advertising claim that more than 80% of consignors sell over 75% of their consigned items within 3 months.
(A) There is not statistically significant evidence to support the store’s claim since the p-value of 0.0801 is greater than the significance level of 0.05.
(B) There is statistically significant evidence to support the store’s claim since the p-value of 0.04 is less than the significance level of 0.05.
(C) There is statistically significant evidence to support the store’s claim since the p-value of 0.0056 is less than the significance level of 0.05.
(D) There is statistically significant evidence to support the store’s claim since the p-value of 0.0028 is less than the significance level of 0.05.
(E) There is not statistically significant evidence to support the store’s claim since the p-value of 0.9599 is greater than the significance level of 0.05.
▶️ Answer/Explanation
The store’s claim is that more than 80% of consignors meet the condition, so the appropriate hypotheses are:
\(H_0:p=0.80\)
\(H_A:p>0.80\)
Student A reported a two-sided p-value of 0.0801. For the correct one-sided test, the p-value is half of this value:
\(p\text{-value}=\frac{0.0801}{2}=0.04005\approx0.04\)
Since \(0.04 < 0.05\), there is sufficient statistical evidence to support the store’s advertising claim. Therefore, choice (B) is correct.
✅ Answer: (B)
Question
It is claimed that more than 65% of parents begin reading to their child aloud when the child is an infant. A random sample of 256 parents in a school district were selected, and 180 began reading to their child aloud when their child was an infant. A z-test was conducted to test the claim and the p-value was 0.04. Which of the following is an appropriate interpretation of the p-value?
(A) 0.04 is the probability that 180 out of 256 randomly selected parents began reading to their child aloud when the child was an infant if the population proportion actually is 0.65.
(B) 0.04 is the probability that 180 or more out of 256 randomly selected parents began reading to their child aloud when the child was an infant if the population proportion actually is 0.65.
(C) 0.04 is the probability that 70% or more parents began reading to their child aloud when the child was an infant if the sample proportion actually was 0.65.
(D) 0.04 is the probability that 70% of parents began reading to their child aloud when the child was an infant if the population proportion actually is more than 0.65.
(E) 0.04 is the probability that 65% or more randomly selected parents begin reading to their child aloud when the child was an infant if the population proportion actually is 0.70.
▶️ Answer/Explanation
A p-value is the probability of obtaining a sample result at least as extreme as the one observed, assuming the null hypothesis is true.
For this test, the null hypothesis is:
\(H_0:p=0.65\)
The observed sample proportion is:
\(\hat{p}=\frac{180}{256}\approx0.703\)
Therefore, the p-value of 0.04 represents the probability of obtaining a sample result this large or larger (180 or more parents out of 256, or equivalently a sample proportion of about 0.703 or greater) if the true population proportion is actually 0.65.
This matches the interpretation given in choice (B).
✅ Answer: (B)