Home / AP® Exam / AP® Statistics / AP Statistics 4.1 Sampling Distributions for Sample Means- Exam Style Questions – MCQs

AP Statistics 4.1 Sampling Distributions for Sample Means- Exam Style Questions - MCQs - New Syllabus

Question

For the population of 2-year colleges in the U.S., the distribution of total student enrollment is extremely skewed right with a mean of 4093.2 and standard deviation of 6039.3.

Consider the sampling distribution of sample mean enrollment for three different sample sizes. Sampling Distribution 1 is based on samples of 10 colleges, Sampling Distribution 2 is based on samples of 30 colleges, and Sampling Distribution 3 is based on samples of 40 colleges.

Which is most likely true about the 3 sampling distributions?

(A) All three sampling distributions will be equally skewed right because the population is extremely skewed right.
(B) All three sampling distributions will be approximately normal because sampling distributions are normally distributed.
(C) Sampling Distribution 1 will be skewed right but Sampling Distributions 2 and 3 will be approximately normal because they have large sample sizes.
(D) Sampling Distributions 1 and 2 will likely be skewed right considering the population distribution is extremely skewed right and Sampling Distribution 3 will be exactly normal.
(E) All three sampling distributions will likely be skewed right, but Sampling Distribution 1 will be the most skewed and Sampling Distribution 3 will be the least skewed.

▶️ Answer/Explanation

The population distribution is described as extremely skewed right. For small sample sizes, the sampling distribution of the sample mean tends to retain some of that skewness.

According to the Central Limit Theorem, as the sample size increases, the sampling distribution of the sample mean becomes more nearly normal. Therefore, the distribution based on \(n=10\) will be the most skewed, while the distributions based on \(n=30\) and \(n=40\) will be less skewed.

However, because the population is extremely skewed, it is not guaranteed that the sampling distributions for \(n=30\) and \(n=40\) are perfectly normal. The best description is that all three are likely right-skewed, with skewness decreasing as sample size increases.

Answer: (E)

Question

The average amount of time spent on a customer’s first visit on the Blamazon website, an online retailer, is 14 minutes. Blamazon is redesigning their website to determine if they can increase the average amount of time spent on their first visit to their website. A random sample of 45 potential customers (not current Blamazon account holders) is chosen. Only these 45 potential customers are given access to the new redesigned Blamazon website. Each of the potential customers visited the new website, the histogram below shows the distribution of time spent per first visit for those 45 account holders.
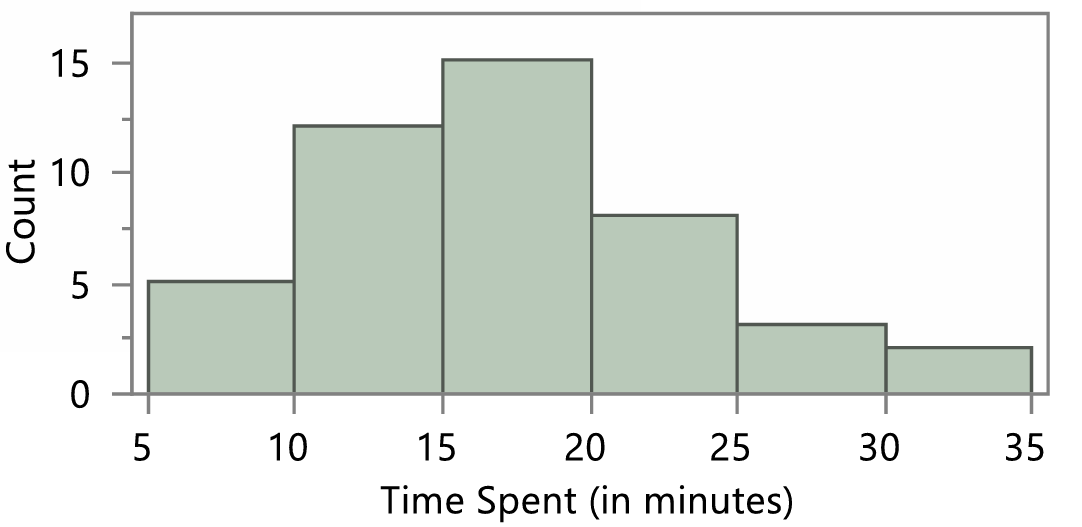
Researchers would like to conduct a one sample t-test for population mean time spent on the first visit to the Blamazon website based on this study. Is the condition that the sampling distribution is normally distributed satisfied? Why?

(A) Yes, because all expected counts are greater than 5.
(B) Yes, because np and n(1-p) are greater than 10, where n is the sample size and p is the proportion of account holders that spent more than 14 minutes on the website.
(C) Yes, because the sample size is large enough.
(D) No, the histogram is skewed right therefore the sampling distribution for the sample mean is not normally distributed.
(E) No, because the population standard deviation is not given.

▶️ Answer/Explanation

The histogram is somewhat skewed to the right, but the sample size is relatively large:

\(n=45\)

According to the Central Limit Theorem, when the sample size is sufficiently large, the sampling distribution of the sample mean will be approximately normal even if the population distribution is not perfectly normal.

Since the sample size exceeds 30 and there are no extreme outliers shown, the normality condition for conducting a one-sample t-test is considered satisfied.

Choices (A) and (B) refer to conditions for proportions, while (E) is not required for a t-test.

Answer: (C)

Question

You and a friend are rolling a fair, six-sided die. You will roll the die 20 times; let \(X\) be the number of 1’s, 3’s, or 5’s that you roll. Your friend will roll the die 9 times; let \(Y\) be the number of 5’s or 6’s that are rolled. Since the random variables \(X\) and \(Y\) are binomial and independent, what is the variance of \(X – Y\)?

(A) 3
(B) 7
(C) 29
(D) \( \frac{55}{36} \)
(E) \( \frac{1}{6} \)

▶️ Answer/Explanation

For \(X\):
\( X \sim \text{Binomial}(20,\frac{3}{6}) \)
\( X \sim \text{Binomial}(20,\frac{1}{2}) \)

\( \text{Var}(X) = np(1-p) \)
\( = 20\left(\frac{1}{2}\right)\left(\frac{1}{2}\right) \)
\( = 5 \)

For \(Y\):
\( Y \sim \text{Binomial}(9,\frac{2}{6}) \)
\( Y \sim \text{Binomial}(9,\frac{1}{3}) \)

\( \text{Var}(Y) = np(1-p) \)
\( = 9\left(\frac{1}{3}\right)\left(\frac{2}{3}\right) \)
\( = 2 \)

Since \(X\) and \(Y\) are independent:
\( \text{Var}(X-Y) = \text{Var}(X)+\text{Var}(Y) \)
\( = 5 + 2 \)
\( = 7 \)

Therefore, the variance of \(X-Y\) is 7.

Answer: (B)

Scroll to Top