AP Statistics 4.10 Carrying Out a Test for the Difference Between Two Population Means- Exam Style Questions - MCQs - New Syllabus
Question
Prior to taking an exam, students were given the option to take a practice exam. Out of a random sample of 55 students who took the practice exam, their average exam score was 85% with a standard deviation of 12%. Out of a random sample of 65 students who did not take the practice exam, their average exam score was 76% with a standard deviation of 24%.
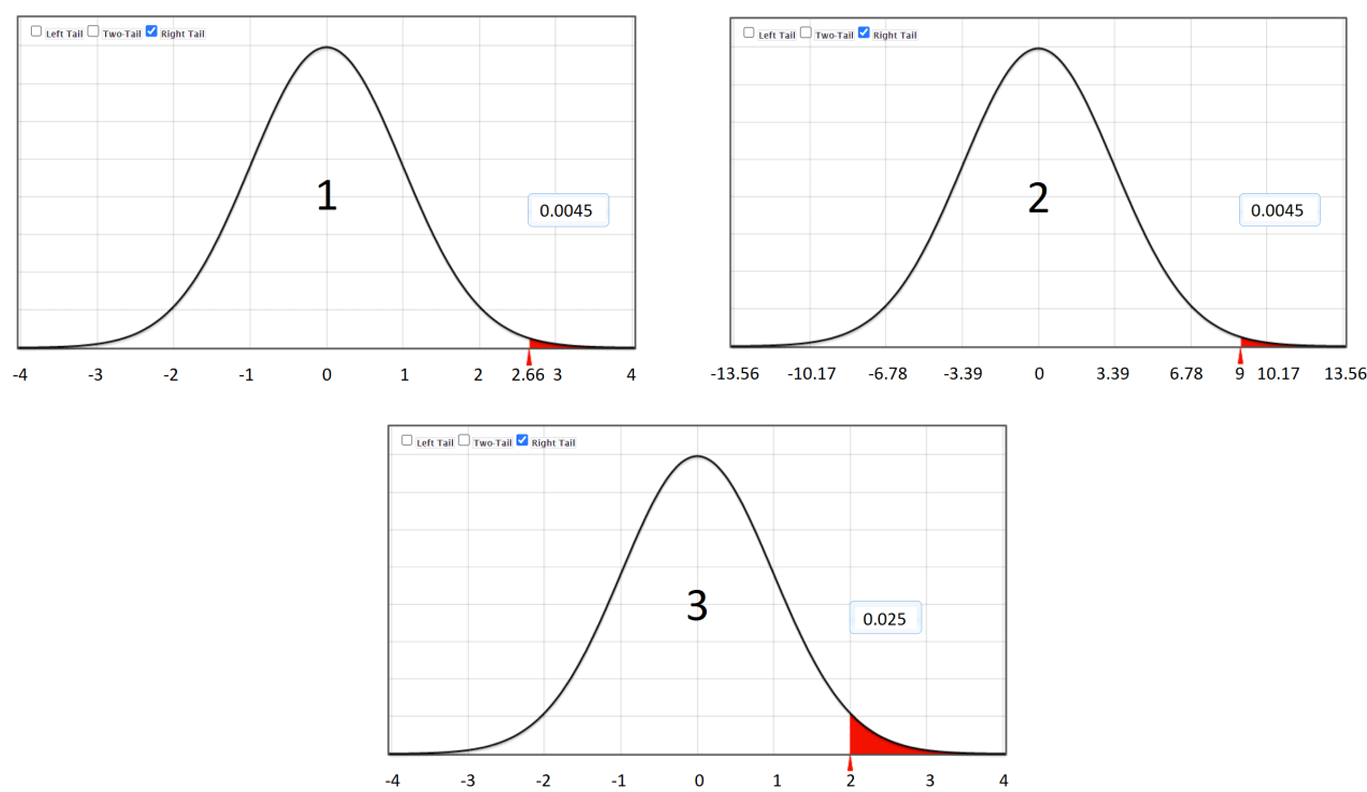
A hypothesis based on the t-distribution was conducted to see if the population mean exam score for students who take a practice exam is more than the population mean exam score for students who do not take a practice exam. Assuming the conditions for the test are met, which of the following is an accurate representation of the p-value?

(A) Graph 1
(B) Graph 2
(C) Graph 3
(D) Graphs 1 and 2
(E) None of the graphs
▶️ Answer/Explanation
The hypotheses are:
\(H_0:\mu_1-\mu_2=0\)
\(H_A:\mu_1-\mu_2>0\)
where \(\mu_1\) is the mean score for students who took the practice exam and \(\mu_2\) is the mean score for students who did not.
The observed difference in sample means is:
\(85-76=9\)
which is positive, so this is a right-tailed t-test. The p-value is the area to the right of the observed t-statistic on a t-distribution.
Graph 1 shows a right-tail area of approximately 0.0045 on a t-distribution with a test statistic around 2.66. Graph 2 shows the same p-value but uses an unrealistic scale for the t-statistic. Graph 3 shows a different p-value (0.025).
Therefore, Graph 1 is the correct representation of the p-value for this test.
✅ Answer: (B)
Question
A survey was conducted with a random sample of 250 U.S. adults who had school-age children and 300 U.S. adults who did not have school-age children. Each adult reported their current salary. The average salary for the 250 adults who had school-age children was $\$54,420$ and the average salary for the 300 adults who did not have school-age children was $\$63,050$.
Research Question: Is the population mean salary different for people who have school-age children versus those not having school-age children?
What is the correct alternative hypothesis statement?
(A) \(\mu_1 \ne \mu_2\) where 1 = people who have school-age children and 2 = people who do not have school-age children
(B) \(\mu_1 = \mu_2\) where 1 = people who have school-age children and 2 = people who do not have school-age children
(C) \(\mu_1 < \mu_2\) where 1 = people who have school-age children and 2 = people who do not have school-age children
(D) \(p_1 \ne p_2\) where 1 = people who have school-age children and 2 = people who do not have school-age children
(E) \(p_1 < p_2\) where 1 = people who have school-age children and 2 = people who do not have school-age children
▶️ Answer/Explanation
The research question asks whether the population mean salary is different between two groups. Because the parameter of interest is a mean, the hypotheses must use \(\mu\), not \(p\).
The phrase “is different” indicates a two-sided test, so the alternative hypothesis should allow for either group to have the larger mean.
Therefore, the correct alternative hypothesis is:
\(H_A:\mu_1 \ne \mu_2\)
where group 1 consists of adults with school-age children and group 2 consists of adults without school-age children.
✅ Answer: (A)
Question
Dan, a trainer at the Popular Gym, was interested in comparing levels of physical fitness of students attending a nearby community college and those attending a 4-year college in town. He selected a random sample of 320 students from the community college. The mean and standard deviation of their fitness scores were 95 and 10, respectively. Dan also selected a random sample of 320 students from a 4-year college. The mean and standard deviation of their fitness scores were 92 and 13, respectively. He then conducted a two-sided t-test that resulted in a t-value of 3.27. Which of the following is an appropriate conclusion from this study?
(A) Because the sample means only differed by 3, the population means are not significantly different.
(B) Because the second group had a larger standard deviation, their mean fitness score is significantly higher.
(C) Because the second group had a larger standard deviation, the mean fitness score of the first group is significantly higher.
(D) Because the p-value is less than \(\alpha = 0.05\), the mean fitness scores for the two groups of students are significantly different.
(E) Because the p-value is greater than \(\alpha = 0.05\), the mean fitness scores for the two groups of students are significantly different.
▶️ Answer/Explanation
A two-sided t-test was performed to compare the population mean fitness scores. The reported test statistic is:
\( t = 3.27 \)
With large sample sizes of 320 students in each group, a t-value of 3.27 produces a very small p-value.
Since the p-value is less than the common significance level:
\( \alpha = 0.05 \)
we reject the null hypothesis and conclude that there is significant evidence that the population mean fitness scores differ between the two groups.
✅ Answer: (D)
