AP Statistics 4.2 Estimating Probabilities Using Simulation- MCQs - Exam Style Questions
Question
Step 1: From 600 chips, assign 88 red and the rest blue.
Step 2: Select 30 chips at random without replacement.
Step 3: Record the number of red chips in the selection of 30.
The results of 1,000 trials of the simulation are shown in the histogram.

(B) Yes, because the number in the histogram with the greatest frequency is 4, not 7.
(C) Yes, because 7 appears in the right tail of the distribution, indicating that it is more than 2 standard deviations away from the mean.
(D) No, because the simulation suggests that it is likely that Audrey could sell anywhere from 0 to 11 of the selected tickets.
(E) No, because the simulation suggests that Audrey selling at least 7 of 30 selected tickets would occur about 13.8% of the time.
▶️ Answer/Explanation
1. Identify the Event:
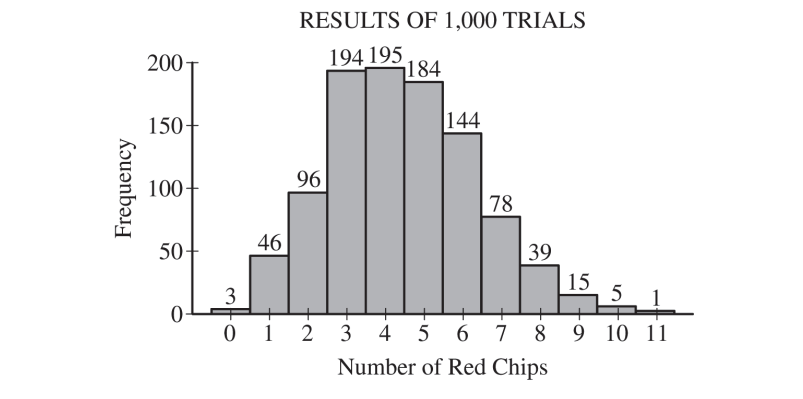
We need to find the probability of Audrey selling “at least 7” of the 30 selected tickets. In the simulation, this corresponds to selecting 7 or more red chips.
2. Sum Frequencies from the Histogram:
We sum the frequencies for 7, 8, 9, 10, and 11 red chips from the provided histogram.
Total trials with $\geq 7$ red chips = (Frequency of 7) + (Frequency of 8) + (Frequency of 9) + (Frequency of 10) + (Frequency of 11)
Total = $78 + 39 + 15 + 5 + 1 = 138$
3. Calculate the Estimated Probability (p-value):
The probability is the sum of these frequencies divided by the total number of trials (1,000).
$p\text{-value} = \frac{138}{1000} = 0.138$
4. Compare to Significance Level ($\alpha$):
The significance level is $\alpha = 0.05$. We compare our p-value to this level.
$0.138 > 0.05$
5. Conclusion:
Since the p-value is greater than the significance level, we fail to reject the null hypothesis. There is not convincing statistical evidence that the event is unlikely to have occurred by chance alone. This matches the reasoning in option (E).
✅ Answer: (E)
Question
(B) The bias will increase and the variance will remain the same.
(C) The bias will remain the same and the variance will decrease.
(D) The bias will remain the same and the variance will increase.
(E) The bias will decrease and the variance will decrease.
▶️ Answer/Explanation
1. Effect on Bias:
Bias is a measure of the accuracy of an estimator. Since the sample is random, the sample mean is an unbiased estimator of the population mean. Increasing the sample size does not affect the bias.
2. Effect on Variance:
Variance is a measure of the precision of an estimator. The variance of the sample mean is \(\frac{\sigma^2}{n}\). As the sample size (\(n\)) increases, the variance decreases.
Therefore, the bias will remain the same, and the variance will decrease.
✅ Answer: (C)