
AP Statistics 4.4 Setting Up a Test for a Population Mean or Population Mean Difference- Exam Style Questions - MCQs - New Syllabus
Question
The average amount of time spent on a customer’s first visit on the Blamazon website, an online retailer, is 14 minutes. Blamazon is redesigning their website to determine if they can increase the average amount of time spent on their first visit to their website. A random sample of 45 potential customers (not current Blamazon account holders) is chosen. Only these 45 potential customers are given access to the new redesigned Blamazon website. Each of the potential customers visited the new website, the histogram below shows the distribution of time spent per first visit for those 45 account holders.
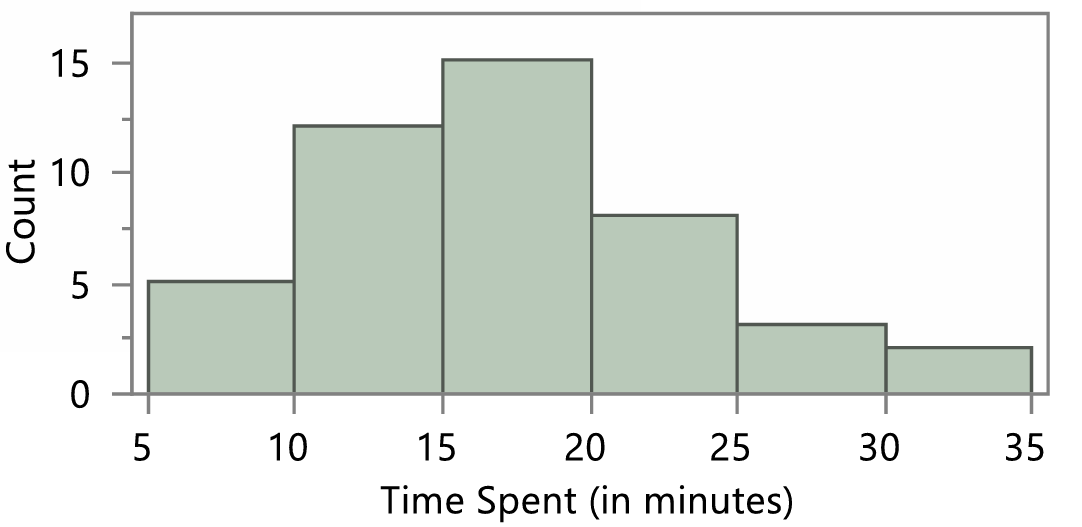
Researchers would like to conduct a one sample t-test for population mean time spent on the first visit to the Blamazon website based on this study. Is the condition that the sampling distribution is normally distributed satisfied? Why?
(A) Yes, because all expected counts are greater than 5.
(B) Yes, because np and n(1-p) are greater than 10, where n is the sample size and p is the proportion of account holders that spent more than 14 minutes on the website.
(C) Yes, because the sample size is large enough.
(D) No, the histogram is skewed right therefore the sampling distribution for the sample mean is not normally distributed.
(E) No, because the population standard deviation is not given.
▶️ Answer/Explanation
The histogram is somewhat skewed to the right, but the sample size is relatively large:
\(n=45\)
According to the Central Limit Theorem, when the sample size is sufficiently large, the sampling distribution of the sample mean will be approximately normal even if the population distribution is not perfectly normal.
Since the sample size exceeds 30 and there are no extreme outliers shown, the normality condition for conducting a one-sample t-test is considered satisfied.
Choices (A) and (B) refer to conditions for proportions, while (E) is not required for a t-test.
✅ Answer: (C)
Question
City councilors are interested in the amount of time visitors spend at the city’s new park, Barker Park. Over the course of a few weeks, and with the help of statisticians, park monitors randomly chose visitors and recorded the amount of time they spent at the park. The random sample of 62 visitors had a mean time of 32.4 minutes with a standard deviation of 11.9 minutes.
The city councilors conducted a one-sample t-test to test if the population mean time spent visiting the dog park is more than 30 minutes. The p-value was calculated to be 0.06.
What conclusion should be made at the 0.05 level of significance?
(A) There is convincing statistical evidence to suggest the mean amount of time spent visiting Barker Park is more than 30 minutes.
(B) There is convincing statistical evidence to suggest the mean amount of time spent visiting Barker Park is different than 30 minutes.
(C) There is convincing statistical evidence to suggest the mean amount of time spent visiting Barker Park is equal to 30 minutes.
(D) There is not convincing statistical evidence to suggest the mean amount of time spent visiting Barker Park is more than 30 minutes.
(E) There is not convincing statistical evidence to suggest the mean amount of time spent visiting Barker Park is less than 30 minutes.
▶️ Answer/Explanation
The hypotheses for the test are:
\(H_0:\mu = 30\)
\(H_a:\mu > 30\)
The p-value is \(0.06\), which is greater than the significance level of \(0.05\).
Since
\(0.06 > 0.05\),
we fail to reject the null hypothesis. This means the sample does not provide sufficient evidence that the population mean time spent at Barker Park exceeds 30 minutes.
Failing to reject the null hypothesis does not prove that the mean is exactly 30 minutes; it only means there is not enough evidence to support the claim that it is greater than 30 minutes.
✅ Answer: (D)
Question
Researchers want to perform a test of
\( H_0:\mu = 2000 \text{ pounds} \)
versus
\( H_a:\mu > 2000 \text{ pounds} \)
where \( \mu \) is the true mean breaking strength of a 0.25-inch diameter polyester double braid rope. A random sample of 25 such ropes was selected, and the breaking strength of each was determined using a stress test. The sample mean breaking strength was 2095 pounds with a standard deviation of 185 pounds. After checking the conditions, the researchers performed an appropriate significance test and obtained a p-value of 0.0084.
Which of the following is the correct interpretation of the p-value of 0.0084?
(A) There is a 0.0084 probability of getting a sample mean of 2095 pounds by chance in a random sample of 25 ropes.
(B) There is a 0.0084 probability of getting a sample mean of 2095 pounds or more by chance in a random sample of 25 ropes.
(C) Assuming that the mean breaking strength of this population of ropes is 2000 pounds, there is a 0.0084 probability of getting a sample mean of 2095 pounds by chance in a random sample of 25 ropes.
(D) Assuming that the mean breaking strength of this population of ropes is 2000 pounds, there is a 0.0084 probability of getting a sample mean of 2095 pounds or more by chance in a random sample of 25 ropes.
(E) Assuming that the mean breaking strength of this population of ropes is more than 2000 pounds, there is a 0.0084 probability of getting a sample mean of 2095 pounds by chance in a random sample of 25 ropes.
▶️ Answer/Explanation
A p-value is calculated under the assumption that the null hypothesis is true.
Here, the null hypothesis is:
\( H_0:\mu = 2000 \)
Since the alternative hypothesis is:
\( H_a:\mu > 2000 \),
this is a right-tailed test. Therefore, the p-value represents the probability of obtaining a sample mean as large as or larger than the observed sample mean of 2095 pounds, assuming the true population mean is 2000 pounds.
Thus, the correct interpretation is:
“Assuming that the mean breaking strength of this population of ropes is 2000 pounds, there is a 0.0084 probability of getting a sample mean of 2095 pounds or more by chance in a random sample of 25 ropes.”
✅ Answer: (D)