Home / AP® Exam / AP® Statistics / AP Statistics 5.1 Graphical Representations Between Two Quantitative Variables- Exam Style Questions – MCQs

AP Statistics 5.1 Graphical Representations Between Two Quantitative Variables- Exam Style Questions - MCQs - New Syllabus

Question

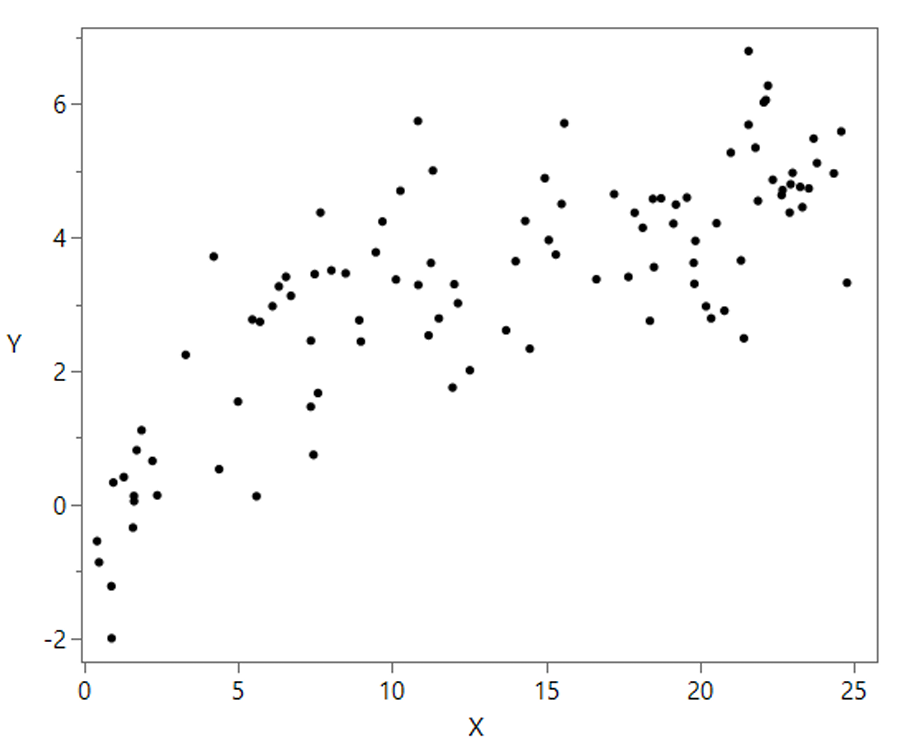
Which of the following is the best description of the relationship displayed in the following scatterplot?

(A) Negative, linear, and strong
(B) Positive, linear, and strong
(C) Negative, nonlinear, and moderate
(D) Positive, nonlinear, and moderate
(E) Negative, nonlinear, and strong

▶️ Answer/Explanation

As the values of X increase, the values of Y also tend to increase. This indicates a positive association between the two variables.

The pattern of points follows a roughly straight-line trend rather than a curved pattern, so the relationship is best described as linear. Although there is some scatter around the trend, the points are clustered closely enough to indicate a strong relationship.

Therefore, the scatterplot shows a positive, linear, and strong association between X and Y.

Answer: (B)

Question

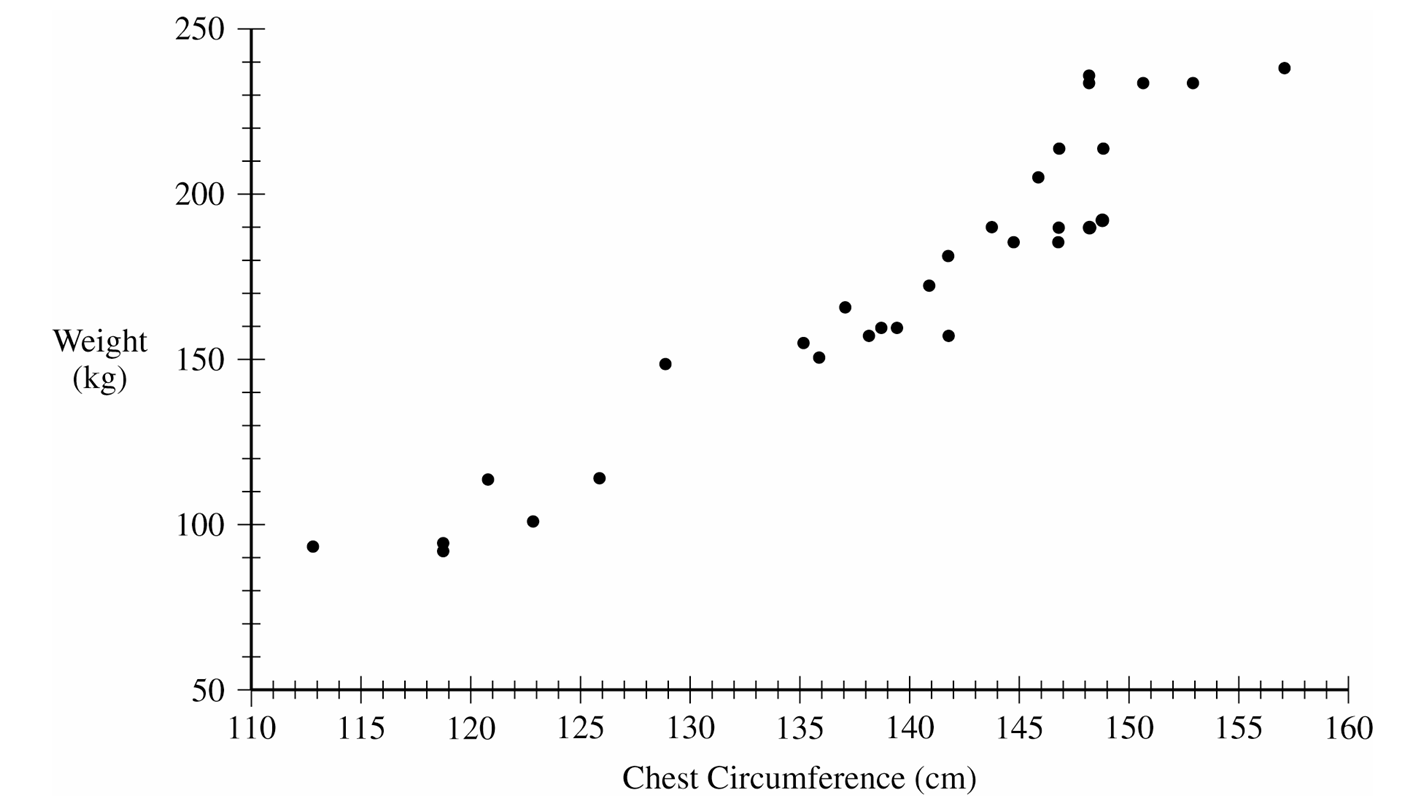
Wildlife biologists are interested in the health of tule elk, a species of deer found in California. An important measurement of tule elk health is their weight. Chest circumference, in centimeters \((\text{cm})\), is believed to be related to the weight of a tule elk, in kilograms \((\text{kg})\). The data for \(30\) male tule elk are shown in the scatterplot.
Which of the following best describes the relationship between chest circumference and weight for the male tule elk?
(A) The relationship is weak, negative, and nonlinear; as chest circumference increases, weight tends to decrease.
(B) The relationship is strong, positive, and approximately linear; as chest circumference increases, weight tends to increase.
(C) The relationship is strong, negative, and approximately linear; as chest circumference increases, weight tends to decrease.
(D) The relationship is weak, positive, and curved; as chest circumference increases, weight increases at a decreasing rate.
▶️ Answer/Explanation

The scatterplot shows a clear upward pattern. As chest circumference increases, the weight of the male tule elk also tends to increase.
The points follow an approximately straight-line pattern, so the form is approximately linear. The points are fairly close to the overall pattern, so the relationship is strong.
Therefore, the relationship between chest circumference and weight is strong, positive, and approximately linear.

Answer: (B)

Question

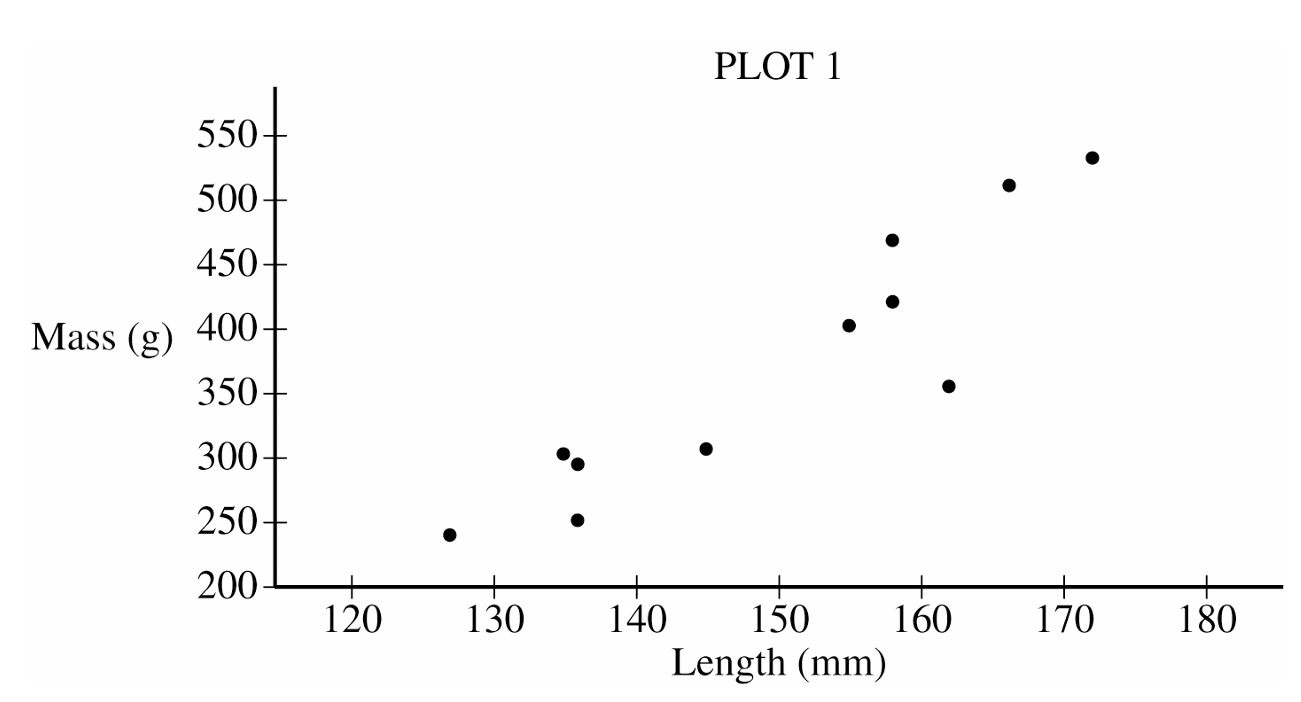
A biologist gathered data on the length, in millimeters \((\text{mm})\), and the mass, in grams \((\text{g})\), for \(11\) bullfrogs. The data are shown in Plot \(1\).
Which of the following best describes the relationship between length and mass for the \(11\) bullfrogs?
(A) The relationship is weak, negative, and nonlinear; as length increases, mass tends to decrease.
(B) The relationship is strong, positive, and roughly linear; as length increases, mass tends to increase.
(C) The relationship is strong, negative, and roughly linear; as length increases, mass tends to decrease.
(D) The relationship is weak, positive, and curved; as length increases, mass increases only slightly.
▶️ Answer/Explanation

The scatterplot shows an upward trend: bullfrogs with greater length generally have greater mass.
The points follow a fairly straight-line pattern, so the form is roughly linear. The points are also fairly close to the overall pattern, so the association is strong.
Therefore, the relationship between bullfrog length and bullfrog mass is strong, positive, and roughly linear.

Answer: (B)

Scroll to Top