Home / AP® Exam / AP® Statistics / AP Statistics 5.2 Correlation- Exam Style Questions – MCQs

AP Statistics 5.2 Correlation- Exam Style Questions - MCQs - New Syllabus

Question

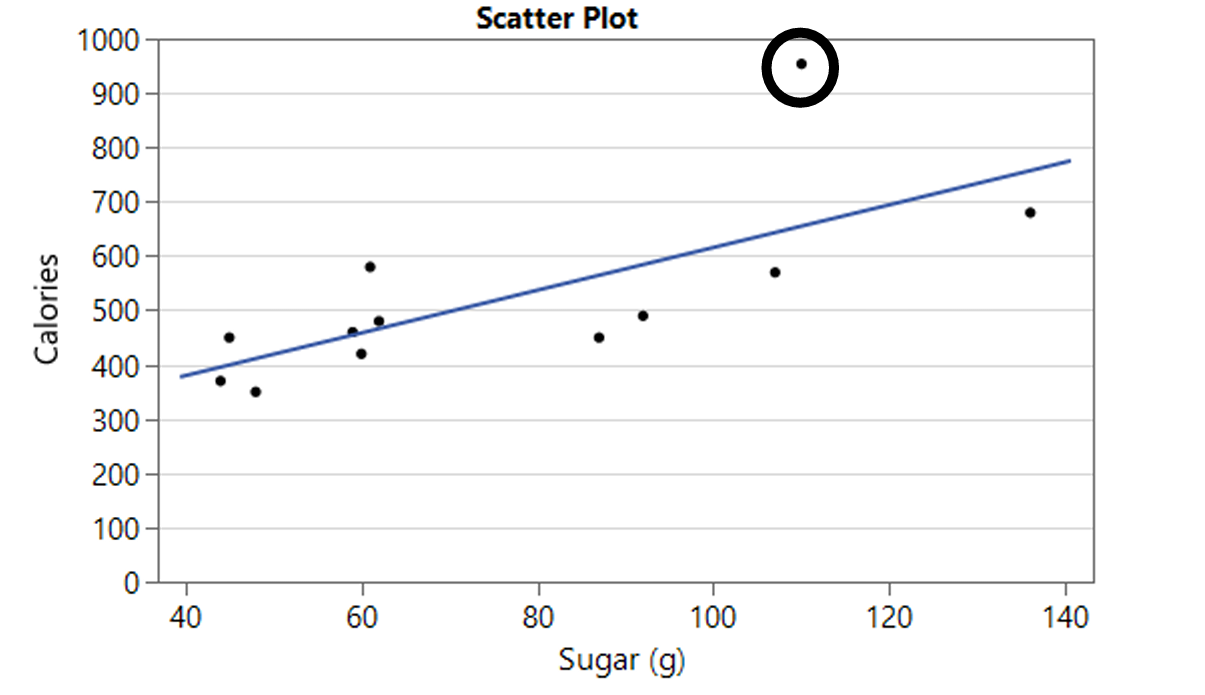
A random sample of 12 types of movie candy was selected. The scatter plot shows the relationship between the amount of sugar and the number of calories in each type of candy. Peanut M&Ms is the candy represented by the circled point on the scatter plot. What would happen to the slope of the least-squares regression line and correlation if this point was removed?

(A) Both the slope and the correlation would increase.
(B) Both the slope and the correlation would decrease.
(C) The slope would increase, and the correlation would decrease.
(D) The slope would decrease, and the correlation would increase.
(E) Neither the slope nor the correlation would change.

▶️ Answer/Explanation

The circled point has a relatively large sugar value and an unusually high calorie value compared with the overall linear trend. This point pulls the regression line upward on the right side, making the slope steeper than it would otherwise be.

If the point is removed, the remaining points follow a more consistent linear pattern. As a result, the regression line becomes less steep, so the slope decreases.

Because the unusual point adds scatter and weakens the linear relationship, removing it makes the remaining data more linear, causing the correlation to increase.

Answer: (D)

Question

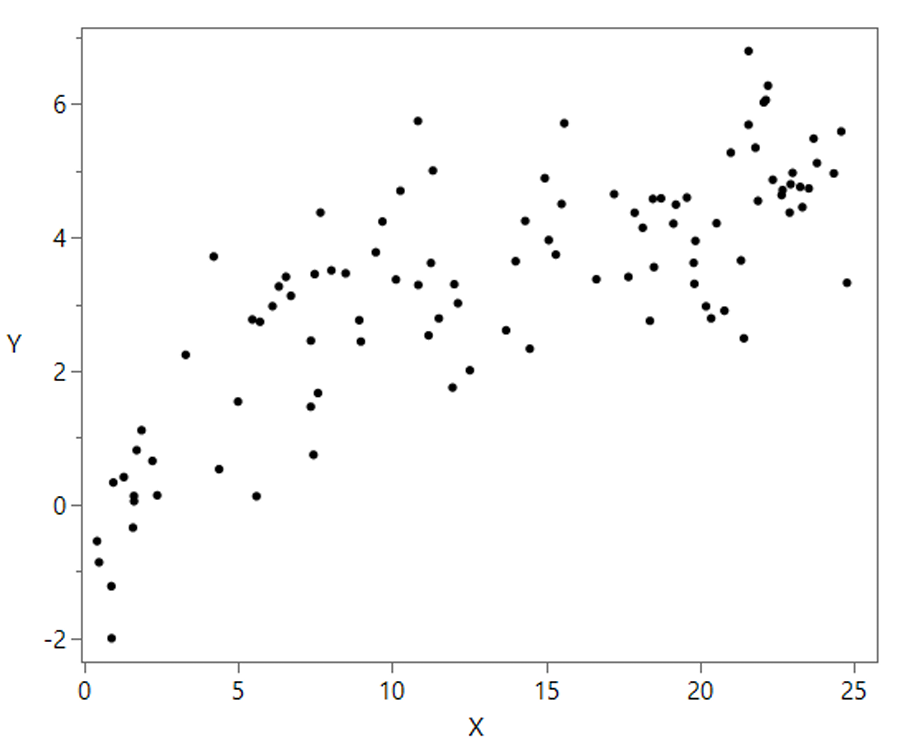
Which of the following is the best description of the relationship displayed in the following scatterplot?

(A) Negative, linear, and strong
(B) Positive, linear, and strong
(C) Negative, nonlinear, and moderate
(D) Positive, nonlinear, and moderate
(E) Negative, nonlinear, and strong

▶️ Answer/Explanation

As the values of X increase, the values of Y also tend to increase. This indicates a positive association between the two variables.

The pattern of points follows a roughly straight-line trend rather than a curved pattern, so the relationship is best described as linear. Although there is some scatter around the trend, the points are clustered closely enough to indicate a strong relationship.

Therefore, the scatterplot shows a positive, linear, and strong association between X and Y.

Answer: (B)

Question 

A delivery service places packages into large containers before flying them across the country. These filled containers vary greatly in their weight. Suppose the delivery service’s airplanes always transport two such containers on each flight. The two containers are chosen so their combined weight is close to, but does not exceed, a specified weight limit. A random sample of flights with these containers is taken, and the weight of each of the two containers on each selected flight is recorded. The weights of the two containers on the same flight

(A) will have a correlation of 0
(B) will have a negative correlation
(C) will have a positive correlation that is less than 1
(D) will have a correlation of 1
(E) cannot be determined from the information given

▶️ Answer/Explanation

The two containers are selected so that their combined weight stays close to a fixed weight limit.

This means that when one container is relatively heavy, the other container must tend to be lighter to keep the total weight near the limit. Likewise, when one container is lighter, the other can be heavier.

As one variable increases, the other tends to decrease. This creates a negative linear association between the two container weights.

Therefore, the weights of the two containers on the same flight will have a negative correlation.

Answer: (B)

Scroll to Top