
AP Statistics 5.3 Linear Regression Models- Exam Style Questions - MCQs - New Syllabus
Question
The following computer output contains the results from fitting a simple linear regression model to predict the diameter at breast height (DBH) in inches from its height in feet of black cherry trees based on a random sample of 31 trees.

Assuming the conditions for inference are satisfied, which of the following gives a 95 percent confidence interval for the true slope of the regression line based on this model?
(A) \(0.25575 \pm (3.272)(0.014)\)
(B) \(0.25575 \pm (3.272)(0.0782)\)
(C) \(0.25575 \pm (1.96)(0.0782)\)
(D) \(0.25575 \pm (2.045)(0.014)\)
(E) \(0.25575 \pm (2.045)(0.0782)\)
▶️ Answer/Explanation
To construct a confidence interval for the true slope, use:
\(\text{Estimate} \pm t^*(SE)\)
The estimated slope is:
\(b_1 = 0.25575\)
The standard error of the slope is:
\(SE_{b_1}=0.0782\)
Since there are \(n=31\) trees, the degrees of freedom are:
\(df=n-2=29\)
For a 95% confidence interval with \(df=29\):
\(t^* \approx 2.045\)
Therefore, the confidence interval is:
\(0.25575 \pm (2.045)(0.0782)\)
✅ Answer: (E)
Question
Alpaca farmers are aware there is often a linear relationship between the age, in years, of an alpaca and the amount of fleece produced, in ounces per month. The least-squares regression line produced from a random sample is
\[\widehat{\text{Fleece}}=40.8-1.1(\text{Age})\]
Based on the model, what is the expected difference in the amounts of fleece of an alpaca of 5 years and an alpaca of 10 years?
(A) An alpaca of 5 years is expected to produce 1.1 less ounces per month than an alpaca of 10 years.
(B) An alpaca of 5 years and an alpaca of 10 years are both expected to produce 40.8 ounces per month.
(C) An alpaca of 5 years is expected to produce 5.5 less ounces per month than an alpaca of 10 years.
(D) An alpaca of 5 years is expected to produce 5.5 more ounces per month than an alpaca of 10 years.
(E) An alpaca of 5 years is expected to produce 1.1 more ounces per month than an alpaca of 10 years.
▶️ Answer/Explanation
The slope of the regression line is -1.1, which means that for every additional year of age, the predicted fleece production decreases by 1.1 ounces per month.
The age difference between the two alpacas is:
\(10-5=5\text{ years}\)
Therefore, the expected difference in fleece production is:
\((-1.1)(5)=-5.5\text{ ounces}\)
This means the 10-year-old alpaca is expected to produce 5.5 fewer ounces per month than the 5-year-old alpaca. Equivalently, the 5-year-old alpaca is expected to produce 5.5 more ounces per month than the 10-year-old alpaca.
✅ Answer: (D)
Question
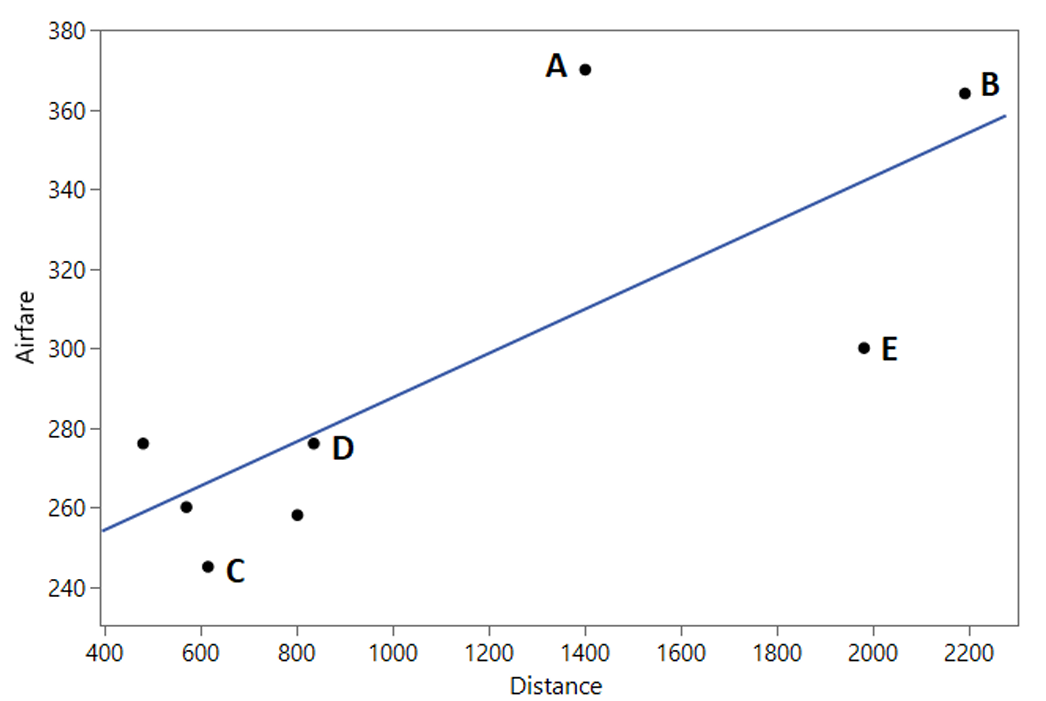
Devon researched the distance of various cities from Atlanta, Georgia compared to the round-trip airfare to each city. Devon’s results are displayed in the scatterplot below.

According to the least squares regression line, which city has the best “value” in airfare based on its distance from Atlanta? A “best value” for this context is defined as having the largest negative residual.
(A) City A
(B) City B
(C) City C
(D) City D
(E) City E
▶️ Answer/Explanation
A residual is calculated as:
\(\text{Residual}=\text{Observed Value}-\text{Predicted Value}\)
A negative residual means the actual airfare is lower than what the regression line predicts. Therefore, the city with the largest negative residual represents the best airfare value for its distance.
Looking at the scatterplot, City E lies well below the regression line and is farther below the line than any of the other labeled cities. City A and City B are above the line (positive residuals), while Cities C and D are only slightly below it.
Therefore, City E has the largest negative residual and thus the best value in airfare based on distance from Atlanta.
✅ Answer: (E)
