AP Statistics 5.4 Residuals- Exam Style Questions - MCQs - New Syllabus
Question
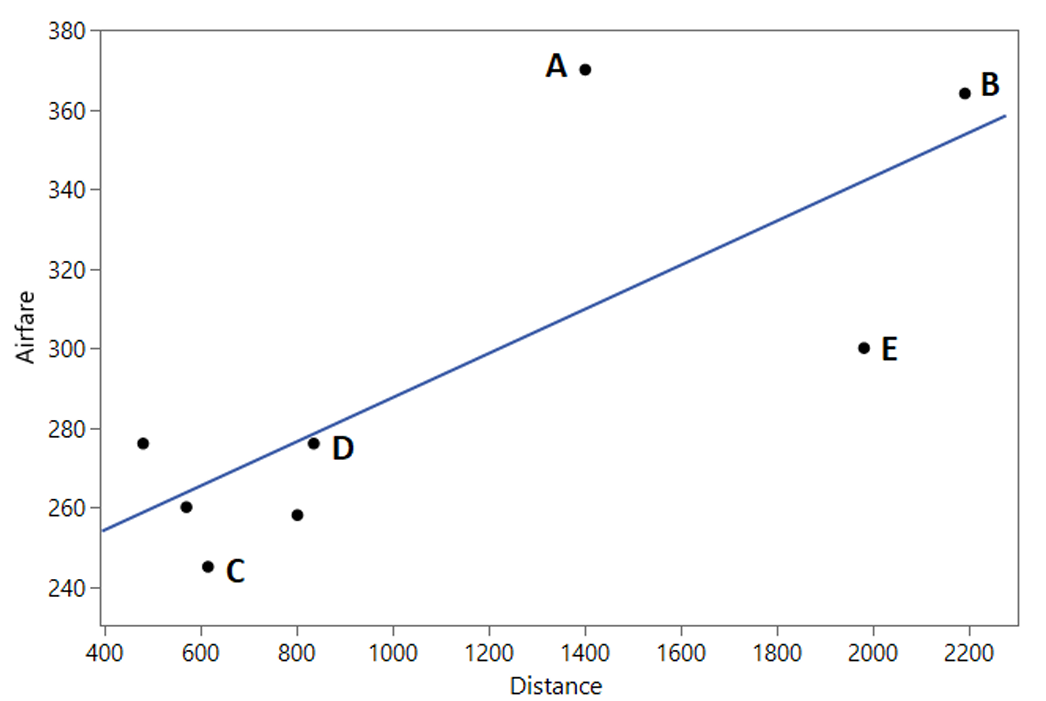
Devon researched the distance of various cities from Atlanta, Georgia compared to the round-trip airfare to each city. Devon’s results are displayed in the scatterplot below.

According to the least squares regression line, which city has the best “value” in airfare based on its distance from Atlanta? A “best value” for this context is defined as having the largest negative residual.
(A) City A
(B) City B
(C) City C
(D) City D
(E) City E
▶️ Answer/Explanation
A residual is calculated as:
\(\text{Residual}=\text{Observed Value}-\text{Predicted Value}\)
A negative residual means the actual airfare is lower than what the regression line predicts. Therefore, the city with the largest negative residual represents the best airfare value for its distance.
Looking at the scatterplot, City E lies well below the regression line and is farther below the line than any of the other labeled cities. City A and City B are above the line (positive residuals), while Cities C and D are only slightly below it.
Therefore, City E has the largest negative residual and thus the best value in airfare based on distance from Atlanta.
✅ Answer: (E)
Question

(B) The residual is negative because the point is below the least-squares regression line; the model overestimates the mass.
(C) The residual is \(0\) because the point lies exactly on the least-squares regression line.
(D) The residual is positive because the actual mass is less than the predicted mass.
▶️ Answer/Explanation

A residual is calculated as
\(\text{residual}=\text{actual mass}-\text{predicted mass}\).
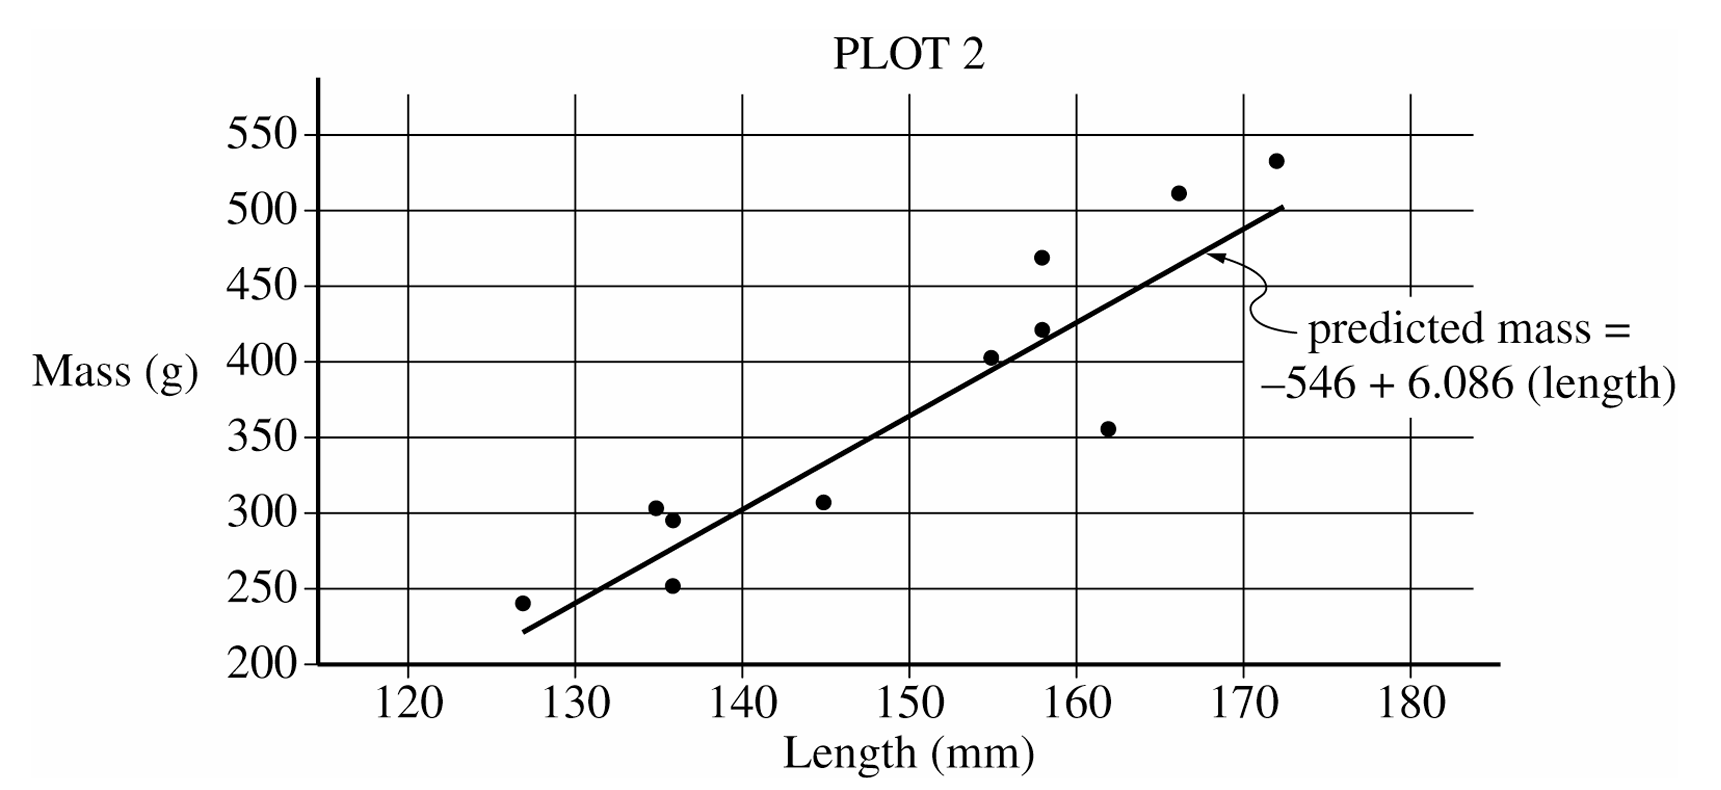
The bullfrog with approximate length \(162\,\text{mm}\) and mass \(356\,\text{g}\) is below the least-squares regression line in Plot \(2\). This means its actual mass is less than its predicted mass.
Therefore, the residual is negative, and the least-squares regression line overestimates the mass of this bullfrog.
✅ Answer: (B)
Question
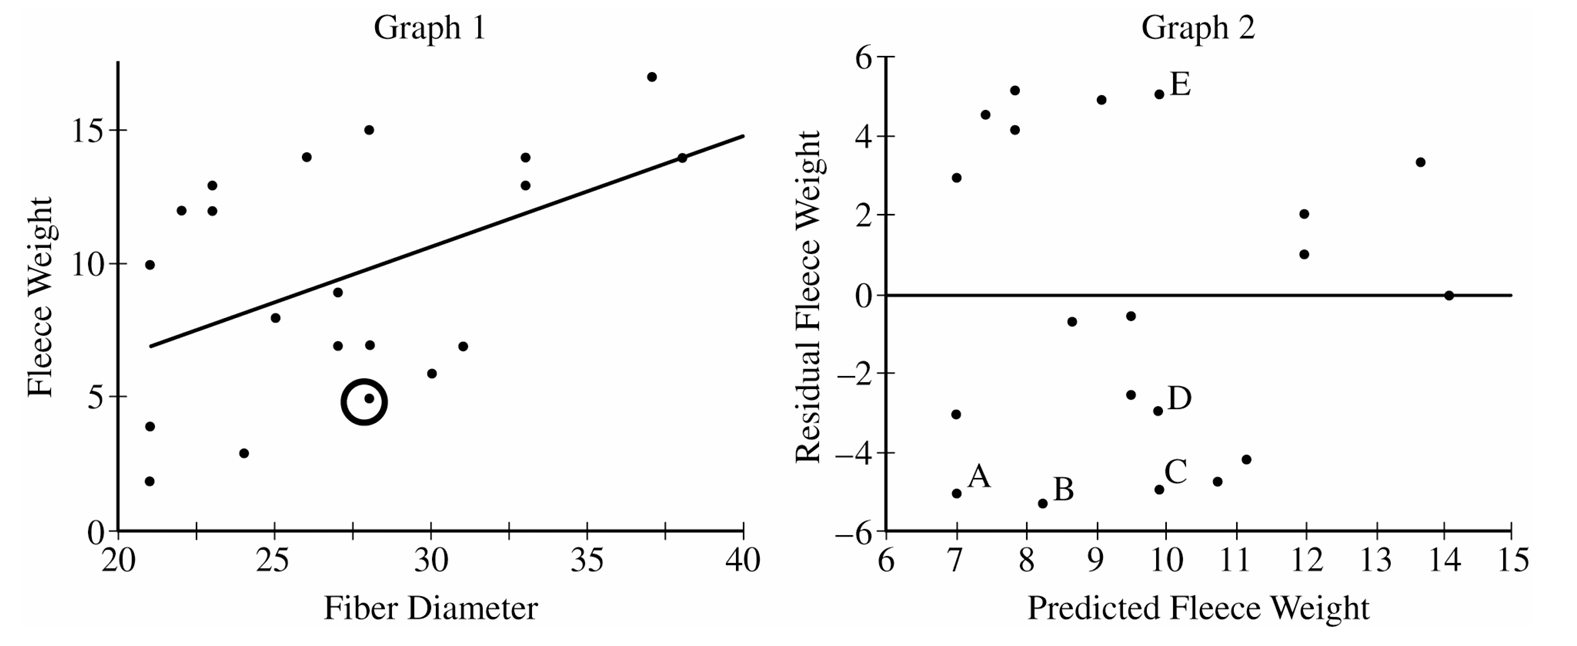
Data were collected on the fiber diameter and the fleece weight of wool taken from a sample of 20 sheep. The data are shown in the following graphs. Graph 1 is a scatterplot of fleece weight versus fiber diameter with the respective least-squares regression line shown. Graph 2 is the associated plot of the residuals versus the predicted values.

One point is circled on graph 1. Five points labeled A, B, C, D, and E are identified on graph 2. Which point on graph 2 represents the residual for the circled point on graph 1 ?
(A) A
(B) B
(C) C
(D) D
(E) E
▶️ Answer/Explanation
The circled point in Graph 1 has a fiber diameter of about 28 and a fleece weight of about 5. The regression line at that x-value predicts a fleece weight close to 10. Therefore, the residual is:
\( \text{Residual} = \text{Observed} – \text{Predicted} \)
\( \text{Residual} \approx 5 – 10 = -5 \)
The predicted value is approximately 10 and the residual is approximately \(-5\). On the residual plot, point C is located near a predicted fleece weight of 10 and a residual of about \(-5\), making it the correct match.
✅ Answer: (C)