Home / AP® Exam / AP® Statistics / 5.8 Sampling Distributions for Differences in Sample Means- FRQs

AP Statistics 5.8 Sampling Distributions for Differences in Sample Means- FRQs - Exam Style Questions

Question

Studies have shown that foods rich in compounds known as flavonoids help lower blood pressure. Researchers conducted a study to investigate whether there was a greater reduction in blood pressure for people who consumed dark chocolate, which contains flavonoids, than people who consumed white chocolate, which does not contain flavonoids.
Twenty-five healthy adults agreed to participate in the study and add \(3.5\) ounces of chocolate to their daily diets. Of the \(25\) participants, \(13\) were randomly assigned to the dark chocolate group and the rest were assigned to the white chocolate group. All participants had their blood pressure recorded, in millimeters of mercury (mmHg), before adding chocolate to their daily diets and again \(30\) days after adding chocolate to their daily diets.
The reduction in blood pressure (before minus after) for each of the participants in the two groups is shown in the dotplots below.
(a) Determine and compare the medians of the reduction in blood pressure for the two groups.
The researchers found the mean reduction in blood pressure for those who consumed dark chocolate is \(\bar{x}_{\text{dark}} = 6.08\) mmHg and the mean reduction in blood pressure for those who consumed white chocolate is \(\bar{x}_{\text{white}} = 0.42\) mmHg.
(b) One researcher indicated that because the difference in sample means of \(5.66\) mmHg is greater than \(0\) there is convincing statistical evidence to conclude that the population mean blood pressure reduction for those who consume dark chocolate is greater than for those who consume white chocolate. Why might the researcher’s conclusion, based only on the difference in sample means of \(5.66\) mmHg, not necessarily be true?
A simulation was conducted to investigate whether there is a greater reduction of blood pressure for those who consume dark chocolate than for those who consume white chocolate. The simulation was conducted under the assumption that no difference exists. The results of \(120\) trials of the simulation are shown in the following dotplot.
(c) Use the results of the simulation to determine whether the results from the \(25\) participants in the study provide convincing statistical evidence, at a \(5\) percent level of significance, that adding dark chocolate to a daily diet will result in a greater reduction in blood pressure, on average, than adding white chocolate to a daily diet. Justify your answer.

Most-appropriate topic codes (CED):

TOPIC 1.9: Comparing Distributions of a Quantitative Variable — part (a)
TOPIC 5.8: Sampling Distributions for Differences in Sample Means — part (b)
TOPIC 6.5: Interpreting p-Values — part (c)
TOPIC 6.6: Concluding a Test for a Population Proportion — part (c)
▶️ Answer/Explanation
Detailed solution

(a)
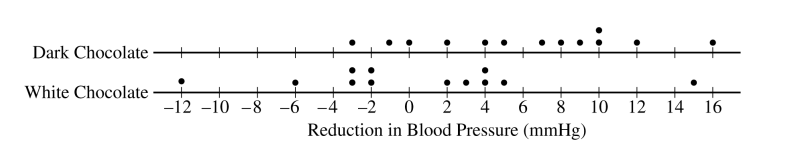
To find the medians, we locate the middle value for each group.
Dark Chocolate Group: There are \(13\) participants. The median is the value of the \(\frac{13+1}{2} = 7^{\text{th}}\) observation. Counting from the left on the dotplot, the \(7^{\text{th}}\) value is \(7\) mmHg.
White Chocolate Group: There are \(25 – 13 = 12\) participants. The median is the average of the \(\frac{12}{2} = 6^{\text{th}}\) and \(7^{\text{th}}\) observations. Counting from the left, the \(6^{\text{th}}\) value is \(-1\) mmHg and the \(7^{\text{th}}\) value is \(1\) mmHg. The median is \(\frac{-1 + 1}{2} = 0\) mmHg.

Comparison: The median reduction in blood pressure for the dark chocolate group (\(7\) mmHg) is greater than the median reduction for the white chocolate group (\(0\) mmHg).

(b)
The researcher’s conclusion is not necessarily true because the observed difference in sample means (\(5.66\) mmHg) could be due to sampling variability. The random assignment of participants into two groups can result in a difference between the groups by chance alone, even if there is no true difference in the effects of the two types of chocolate. A single sample difference is not sufficient evidence. A formal statistical inference procedure is needed to determine the probability of observing a difference this large or larger purely by chance, assuming no real effect exists.

(c)
The observed difference in the mean reduction in blood pressure between the two groups is \(\bar{x}_{\text{dark}} – \bar{x}_{\text{white}} = 6.08 – 0.42 = 5.66\) mmHg.

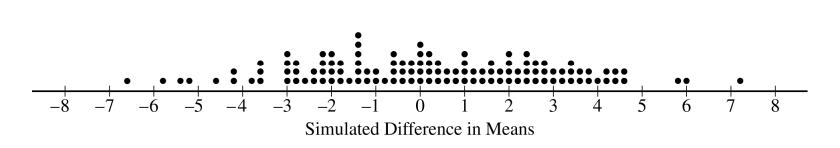
The simulation was conducted under the assumption of no difference. We need to find the probability of observing a difference of \(5.66\) mmHg or greater in this simulation. Looking at the dotplot of simulation results, we count the number of trials where the simulated difference in means was \(5.66\) or more. There is one dot at \(6\), one at \(7\), and one at \(8\). Thus, \(3\) out of the \(120\) trials resulted in a difference of \(5.66\) mmHg or greater.

The estimated p-value is \(P(\text{difference} \geq 5.66) = \frac{3}{120} = 0.025\).

Since the p-value of \(0.025\) is less than the significance level of \(\alpha = 0.05\), we reject the null hypothesis. There is convincing statistical evidence that adding dark chocolate to a daily diet will result in a greater mean reduction in blood pressure than adding white chocolate to a daily diet for people similar to those in this study.

Scroll to Top