AP Statistics 7.1 Introducing Statistics: Should I Worry About Error?- FRQs - Exam Style Questions
Question
Tropical storms in the Pacific Ocean with sustained winds that exceed 74 miles per hour are called typhoons. Graph A below displays the number of recorded typhoons in two regions of the Pacific Ocean—the Eastern Pacific and the Western Pacific—for the years from 1997 to 2010.![]()
Graph A: Yearly Frequency of Typhoons (1997-2010)
(a) Compare the distributions of yearly frequencies of typhoons for the two regions of the Pacific Ocean for the years from 1997 to 2010.
(b) For each region, describe how the yearly frequencies changed over the time period from 1997 to 2010.
A moving average for data collected at regular time increments is the average of data values for two or more consecutive increments. The 4-year moving averages for the typhoon data are provided in the table below.![]()
(c) Show how to calculate the 4-year moving average for the year 2010 in the Western Pacific. Write your value in the appropriate place in the table.
(d) Graph B below shows both yearly frequencies (connected by dashed lines) and the respective 4-year moving averages (connected by solid lines). Use your answer in part (c) to complete the graph.
(e) Consider graph B.
i) What information is more apparent from the plots of the 4-year moving averages than from the plots of the yearly frequencies of typhoons?
ii) What information is less apparent from the plots of the 4-year moving averages than from the plots of the yearly frequencies of typhoons?
Most-appropriate topic codes (CED):
• TOPIC 2.4: Representing the Relationship Between Two Quantitative Variables — part (b)
• TOPIC 7.1: Introducing Statistics: Should I Worry About Error? — parts (c)-(e)
▶️ Answer/Explanation
(a)
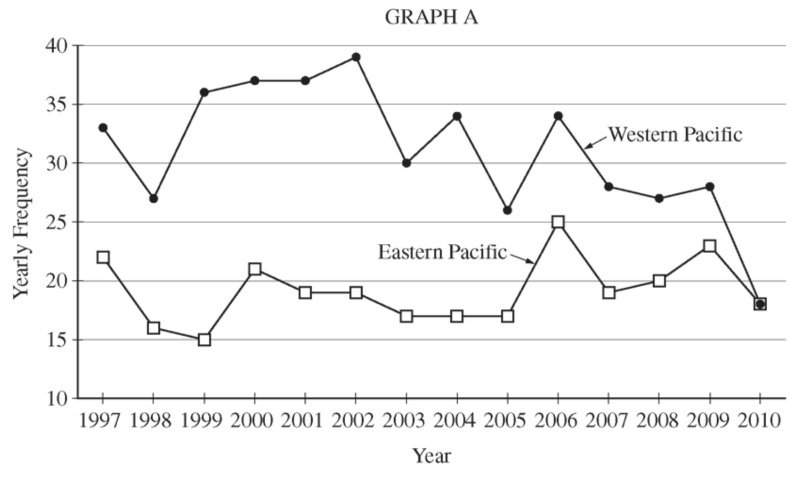
1. Center: The Western Pacific had more typhoons than the Eastern Pacific in almost all years. The average was about \(31\) typhoons/year for Western Pacific vs. about \(19\) typhoons/year for Eastern Pacific.
2. Variability: The Western Pacific showed more variability (range ≈ \(21\) typhoons) than the Eastern Pacific (range ≈ \(10\) typhoons).
3. Context: The Western Pacific region consistently experiences more typhoons annually with greater year-to-year fluctuation.
(b)
• Western Pacific: Showed a clear decreasing trend over the time period, especially from around \(2001\) to \(2010\).
• Eastern Pacific: Remained relatively consistent over the time period, with a slight increasing trend in the later years (\(2005\)-\(2010\)).
(c)
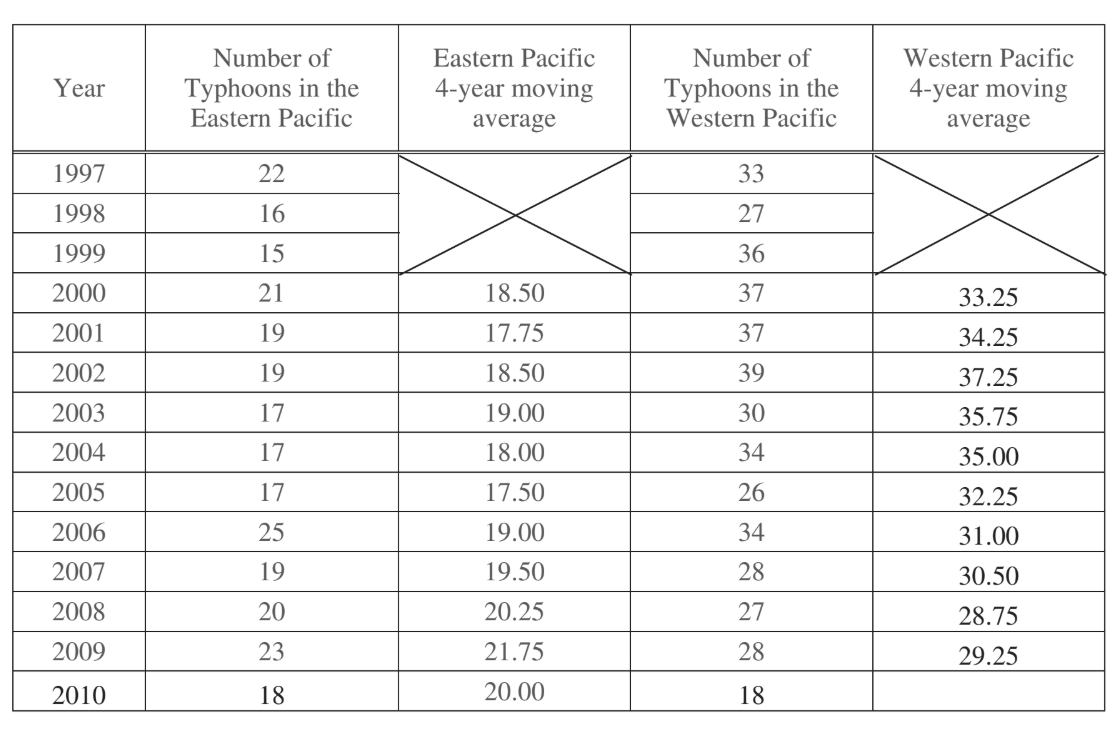
The 4-year moving average for Western Pacific in \(2010\) uses data from \(2007\), \(2008\), \(2009\), and \(2010\):
\[ \frac{28 + 27 + 28 + 18}{4} = \frac{101}{4} = 25.25 \]
The value \(25.25\) should be written in the table for Western Pacific 4-year moving average for \(2010\).
(d)
On Graph B, plot the point for Western Pacific 4-year moving average at year \(2010\) and frequency \(25.25\), then connect this point to the previous moving average point at \(2009\).
(e)
i) More apparent: The overall long-term trends are more visible. The moving averages clearly show the decreasing trend in Western Pacific and the slight increasing trend in Eastern Pacific.
ii) Less apparent: The year-to-year variability is smoothed out, making individual yearly fluctuations less noticeable.
