Home / AP® Exam / AP® Statistics / 7.5 Carrying Out a Test for a Population Mean- FRQs

AP Statistics 7.5 Carrying Out a Test for a Population Mean- FRQs - Exam Style Questions

Question

A medical researcher completed a study comparing an omega-3 fatty acids supplement to a placebo in the treatment of irritability in patients with a certain medical condition. Nineteen patients with the medical condition volunteered to participate in the study. The study was conducted using the following weekly schedule.
• Week 1: Each patient took a randomly assigned treatment, omega-3 supplement or placebo.
• Week 2: The patients did not take either the omega-3 supplement or the placebo. This was necessary to reduce the possibility of any carryover effect from the assigned treatment taken during week 1.
• Week 3: Each patient took the treatment, omega-3 supplement or placebo, that they did not take during week 1.
At the end of week 1 and week 3, each patient’s irritability was given a score on a scale of 0 to 10, with 0 representing no irritability and 10 representing the highest level of irritability.
For each patient, the two irritability scores and the difference in their scores (placebo minus omega-3) were recorded. The results are summarized in the table and boxplots.
 \( n \)MeanStandard Deviation
Placebo\( 19 \)\( 5.421 \)\( 2.987 \)
Omega-3\( 19 \)\( 3.632 \)\( 1.739 \)
Difference (placebo minus omega-3)\( 19 \)\( 1.789 \)\( 2.485 \)
The researcher claims the omega-3 supplement will decrease the mean irritability score of all patients with the medical condition similar to the volunteers who participated in the study. Is there convincing statistical evidence to support the researcher’s claim at a significance level of \( \alpha = 0.05 \)? Complete the appropriate inference procedure to support your answer.

Most-appropriate topic codes (CED):

TOPIC 7.5: Carrying Out a Test for a Population Mean — sections 1-3
TOPIC 7.4: Setting Up a Test for a Population Mean — section 1
TOPIC 7.7: Justifying a Claim About a Population Mean Based on a Confidence Interval — alternative approach
▶️ Answer/Explanation
Detailed solution

State: We will conduct a paired t-test for a population mean difference.
Let \( \mu_d \) = true mean difference (placebo minus omega-3) in irritability scores for all patients with this medical condition.
\( H_0: \mu_d = 0 \)
\( H_a: \mu_d > 0 \)
\( \alpha = 0.05 \)

Plan: We verify the conditions:
Random: Treatments were randomly assigned to weeks for each patient.
10% Condition: Not needed since this is an experiment.
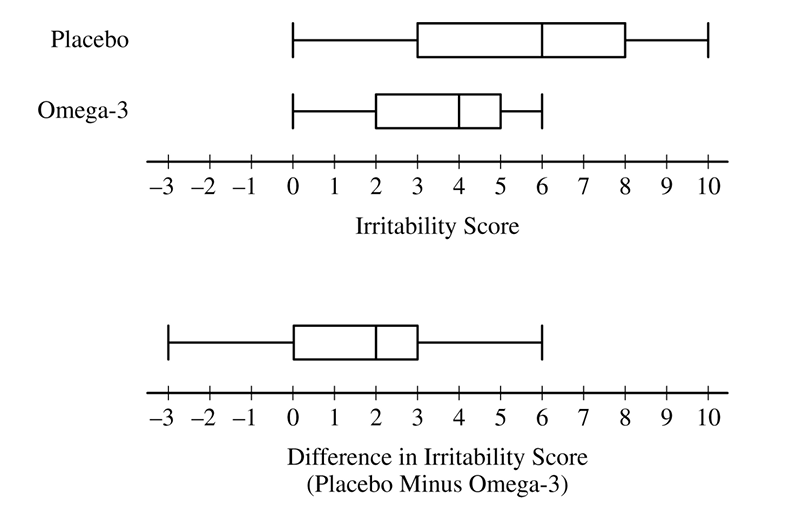
Normal/Large Sample: The sample size (\( n = 19 \)) is less than 30, but the boxplot of differences shows an approximately symmetric distribution with no outliers, so the sampling distribution of \( \bar{x}_d \) should be approximately normal.

Do: Test statistic:
\( t = \frac{\bar{x}_d – \mu_0}{s_d/\sqrt{n}} = \frac{1.789 – 0}{2.485/\sqrt{19}} \approx \frac{1.789}{0.570} \approx 3.138 \)
Degrees of freedom: \( df = 19 – 1 = 18 \)
p-value: \( P(t > 3.138) \approx 0.0028 \)

Conclude: Since p-value \( = 0.0028 < \alpha = 0.05 \), we reject \( H_0 \). There is convincing statistical evidence that the true mean difference (placebo minus omega-3) in irritability scores for all patients with this medical condition is greater than zero. This supports the researcher’s claim that the omega-3 supplement decreases the mean irritability score.

Scroll to Top