Home / AP® Exam / AP® Statistics / 8.2 Setting Up a Chi-Square Goodness of Fit Test – MCQs

AP Statistics 8.2 Setting Up a Chi-Square Goodness of Fit Test - MCQs - Exam Style Questions

Question

A random sample of 1,018 city residents were asked to rate their level of support for a proposal being considered by the city council. The table shows the responses by level of support.
Level of SupportNumber of Responses
Very supportive336
Somewhat supportive387
Not supportive295
Based on the responses, which of the following is a 95 percent confidence interval for the proportion of all city residents who would respond very supportive or somewhat supportive of the proposal?
(A) $0.33\pm0.029$
(B) $0.38\pm0.030$
(C) $0.71\pm0.058$
(D) $0.71\pm0.031$
(E) $0.71\pm0.028$
▶️ Answer/Explanation
Detailed solution

1. Find the Sample Proportion ($\hat{p}$):
We are interested in residents who are “very supportive” or “somewhat supportive.”
Number of supportive residents ($x$) = $336 + 387 = 723$.
Total sample size ($n$) = $1,018$.
$\hat{p} = \frac{x}{n} = \frac{723}{1018} \approx 0.7102$

2. Determine the Formula and Critical Value ($z^*$):
The formula for a one-proportion confidence interval is: $\hat{p} \pm z^* \sqrt{\frac{\hat{p}(1-\hat{p})}{n}}$
For a 95% confidence level, the critical value $z^*$ is 1.96.

3. Calculate the Margin of Error (ME):
$ME = 1.96 \times \sqrt{\frac{0.7102(1-0.7102)}{1018}}$
$ME = 1.96 \times \sqrt{\frac{0.7102(0.2898)}{1018}}$
$ME = 1.96 \times \sqrt{0.000202} \approx 1.96 \times 0.0142 \approx 0.0279$

4. Construct the Interval:
The interval is approximately $0.71 \pm 0.028$.
Answer: (E)

Question

In a standard golf tournament, golfers play 18 holes of golf on each of 4 consecutive days. For each hole, golfers keep track of the number of times they hit the ball (strokes) before the ball goes into the cup. A golfer’s score for the tournament is the total number of strokes needed to complete the tournament. The boxplots below summarize the scores for golfers who competed in tournament 1 and golfers who competed in tournament 2.
Based on the boxplots, which of the following statements must be true?
(A) More golfers played in tournament 1 than in tournament 2.
(B) In both tournaments, at least half the golfers completed the tournament with a score less than 288.
(C) The number of golfers who completed tournament 1 with a score less than 288 was greater than the number of golfers who completed tournament 2 with a score less than 288.
(D) The range of scores for tournament 1 is less than the range of scores for tournament 2.
(E) The score of the golfer with the least score in tournament 1 was greater than the score of the golfer with the least score in tournament 2.
▶️ Answer/Explanation
Detailed solution

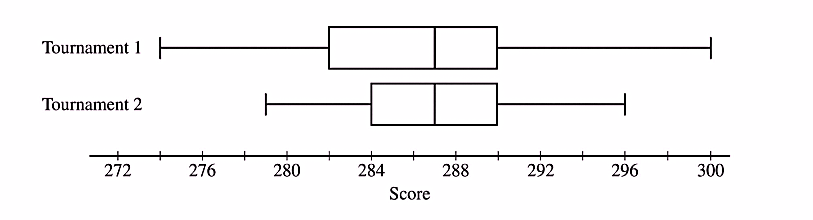
The median (the line inside the box) represents the 50th percentile. By inspecting the boxplots:

– The median score for Tournament 1 is approximately \(287\).
– The median score for Tournament 2 is approximately \(287\).

Since both medians are less than \(288\), it means that for both tournaments, at least \(50\%\) (half) of the golfers had scores at or below the median, which is a value less than \(288\). Therefore, this statement must be true. The other statements make claims about sample size or specific values that cannot be confirmed from a boxplot.
Answer: (B)

Scroll to Top