▶️ Answer/Explanation
(a)
(i) Relative frequency table:
| Clinic A | Clinic B | |
|---|---|---|
| Unsuccessful treatment | \( \frac{51}{139} \approx 0.367 \) | \( \frac{33}{68} \approx 0.485 \) |
| Successful treatment | \( \frac{88}{139} \approx 0.633 \) | \( \frac{35}{68} \approx 0.515 \) |
(ii) Clinic A is more successful. Clinic A has a higher success rate (\( 63.3\% \)) compared to Clinic B (\( 51.5\% \)).
(b)
No, a statistically significant result would not allow researchers to conclude causation. This is an observational study (not a randomized experiment) where patients were not randomly assigned to clinics. There may be confounding variables, such as allergy severity, that affect both the clinic a patient attends and the success of treatment.
(c)
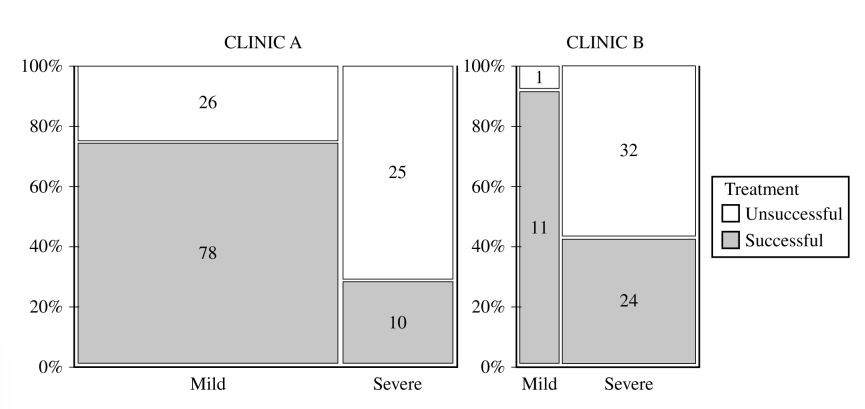
(i)
• Clinic A: More successful in treating mild allergies (\( \frac{78}{104} = 0.75 \)) than severe (\( \frac{10}{35} \approx 0.286 \))
• Clinic B: More successful in treating mild allergies (\( \frac{11}{12} \approx 0.917 \)) than severe (\( \frac{24}{56} \approx 0.429 \))
(ii)
• Clinic A: More likely to treat mild allergy sufferers (\( \frac{104}{139} \approx 0.748 \)) than severe (\( \frac{35}{139} \approx 0.252 \))
• Clinic B: More likely to treat severe allergy sufferers (\( \frac{56}{68} \approx 0.824 \)) than mild (\( \frac{12}{68} \approx 0.176 \))
(d)
The overall success rate favored Clinic A in part (a-ii), which is different from the physician’s conclusion. This is an example of Simpson’s Paradox. Clinic A treats mostly mild cases (\( 74.8\% \)) which have higher success rates, while Clinic B treats mostly severe cases (\( 82.4\% \)) which have lower success rates. When we look within each severity level, Clinic B actually has higher success rates for both mild (\( 91.7\% \) vs \( 75.0\% \)) and severe (\( 42.9\% \) vs \( 28.6\% \)) allergies. The overall success rates are misleading because the clinics treat different types of patients.