▶️ Answer/Explanation
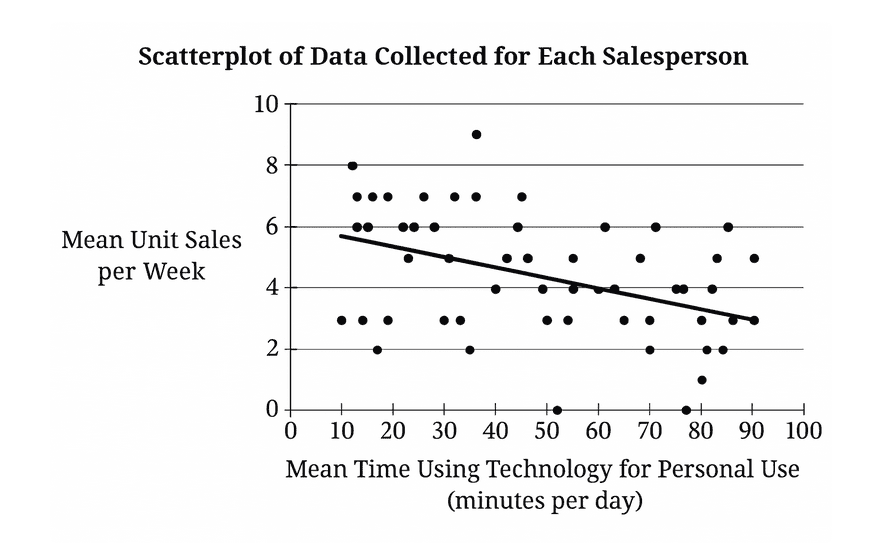
The interval is for the slope \(\beta_1\) of the population regression line (sales vs. personal-use minutes).
• Interpretation of endpoints: with 95% confidence, \(\beta_1\) lies between \(-0.0525\) and \(-0.0124\).
• Because the entire interval is below zero, \(0\notin(-0.0525,-0.0124)\), which indicates a statistically significant negative linear association at the 5% level.
• Contextual slope meaning: for each additional \(1\) minute of personal-use time, the mean sales per week is expected to change by between \(-0.0525\) and \(-0.0124\) units, i.e., a decrease on average.
• Options (A), (B), (C), and (D) misuse the parameter (they talk about the mean or the wrong null or \(-1\) instead of \(0\)).
✅ Therefore, the supported conclusion is exactly described by (E).