Home / AP® Exam / AP® Statistics / 9.4 Setting Up a Test for the Slope of a Regression Model- MCQs

AP Statistics 9.4 Setting Up a Test for the Slope of a Regression Model- MCQs - Exam Style Questions

Question

A student working on a physics project investigated the relationship between the speed and the height of roller coasters. The student collected data on the maximum speed, in miles per hour, and the maximum height, in feet, for a random sample of \(21\) roller coasters, with the intent of testing the slope of the linear relationship between maximum speed and maximum height. However, based on the residual plot shown, the conditions for such a test might not be met.

Based on the residual plot, which condition appears to have been violated?
(A) The errors are independent.
(B) The sum of the residuals is \(0\).
(C) The expected value of the errors is \(0\).
(D) There is a linear relationship between the response variable and the explanatory variable.
(E) The variance of the response variable is constant for all values of the explanatory variable.
▶️ Answer/Explanation
Detailed solution

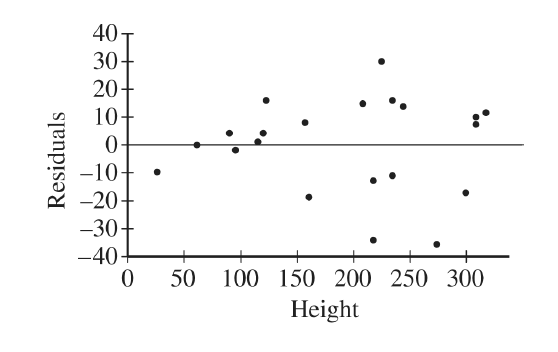
In a residual plot for simple linear regression, the constant variance (equal spread) condition requires the residuals to have roughly the same vertical spread for all \(x\)-values.
From the plot, residuals for heights below about \(125\) feet cluster close to \(0\), while for larger heights the residuals show much greater spread (both positive and negative).
This pattern indicates nonconstant error variance (heteroscedasticity), violating the assumption of equal variance across the range of the explanatory variable.
Therefore, the condition that appears to be violated is constant variance.
Answer: (E)

Question

A fitness center offers a one-month program designed to reduce body fat through exercise. The table shows the body fat percentage before and after completing the program for 10 randomly selected participants.
ParticipantABCDEFGHIJ
Before (%)10.821.518.917.020.824.615.418.219.921.2
After (%)10.720.419.116.120.622.315.518.118.520.0
The director of the program wants to investigate whether knowing the body fat percentage before beginning the program can help to predict body fat percentage for someone who completes the program. Which of the following procedures is the most appropriate for such an investigation?
(A) A matched-pairs t-test for a mean difference
(B) A two-sample t-test for a difference between means
(C) A two-sample z-test for a difference between proportions
(D) A chi-square test of association
(E) A linear regression t-test for slope
▶️ Answer/Explanation
Detailed solution

1. Identify the Goal and Variable Types:
– The goal is to see if one variable can help to **predict** another.
– The “Before” percentage is a quantitative variable.
– The “After” percentage is also a quantitative variable.

2. Select the Appropriate Test:
– A matched-pairs t-test (A) investigates the *mean difference* between paired data, not prediction.
– Two-sample tests (B, C) and chi-square tests (D) are for comparing groups or categories, not for prediction with two quantitative variables.
– A **linear regression t-test for slope** is specifically used to determine if a statistically significant linear relationship exists between two quantitative variables for the purpose of prediction.

Since the goal is prediction between two quantitative variables, this is the correct procedure.
Answer: (E)

Scroll to Top