AP Statistics 1.7 Summary Statistics for a Quantitative Variable- MCQs - Exam Style Questions
Question
For an elementary school science project, each student in a class of 25 students planted 7 seeds of a certain flower and recorded the number of seeds that sprouted. The frequency table summarizes the recorded data.
Results of the Science Project
| Number of Sprouted Seeds | Frequency |
|---|---|
| 0 | 1 |
| 1 | 1 |
| 2 | 0 |
| 3 | 2 |
| 4 | 4 |
| 5 | 11 |
| 6 | 5 |
| 7 | 1 |
Based on the frequency table for the class of 25 students, which of the following best describes the distribution of the number of seeds that sprouted?
(A) The distribution is skewed to the left, and the median number of seeds that sprouted is \(3.5\).
(B) The distribution is skewed to the left, and the median number of seeds that sprouted is \(5\).
(C) The distribution is symmetric, and the median number of seeds that sprouted is \(5\).
(D) The distribution is skewed to the right, and the median number of seeds that sprouted is \(3.5\).
(E) The distribution is skewed to the right, and the median number of seeds that sprouted is \(5\).
▶️ Answer/Explanation
Detailed solution
Total students \(=25\). The median is the \( \frac{25+1}{2}=13^{\text{th}} \) value when ordered.Cumulative counts: \(0:1 \rightarrow 1\); \(1:1 \rightarrow 2\); \(2:0 \rightarrow 2\); \(3:2 \rightarrow 4\); \(4:4 \rightarrow 8\); \(5:11 \rightarrow 19\).
The \(13^{\text{th}}\) value falls in the group with “5 sprouted” \(\Rightarrow\) median \(=5\).
Shape: frequencies rise toward 5 (mode \(=5\)) and then decline more gradually for 6 and 7, creating a longer right tail \(\Rightarrow\) distribution is skewed right.
✅ Answer: (E)
Question
The histogram shows the distribution of heights, in inches, of \(100\) adult men.
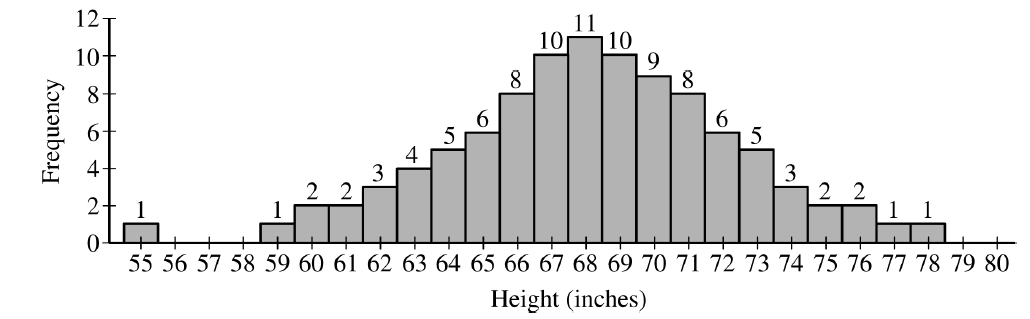
Based on the histogram, which of the following is closest to the interquartile range, in inches, of the distribution?
(A) \(2\)
(B) \(5\)
(C) \(9\)
(D) \(12\)
(E) \(15\)
(B) \(5\)
(C) \(9\)
(D) \(12\)
(E) \(15\)
▶️ Answer/Explanation
Detailed solution
From the histogram of \(100\) men, the first quartile \(Q_1\) is near \(66\) inches (about \(25\%\) at or below), and the third quartile \(Q_3\) is near \(71\) inches (about \(75\%\) at or below).
Interquartile range: \( \text{IQR}=Q_3-Q_1\approx 71-66=5 \) inches.
✅ Answer: (B)