Home / AP® Exam / AP® Statistics / AP Statistics 1.9 Comparing Distributions of a Quantitative Variable – MCQs

AP Statistics 1.9 Comparing Distributions of a Quantitative Variable - MCQs - Exam Style Questions

Question

The back-to-back stemplot shows the list prices for a random sample of 26 new math textbooks and another random sample of 26 new science textbooks at a major university.
List Prices Based on Type of Book
Math Textbook PricesStemScience Textbook Prices
4 3 203 3 4
9 905 5 5 7 7 7 8 9
3 3 3 3 3 3 3 3 1 1 010 3 3 4 4
7 7 7 5 5 5 5 515 7 7 8 9 9 9
8 420 0 4
Key: 1 | 3 represents $130
Based on the back-to-back stemplot, which of the following statements about the textbook prices must be true?
(A) Both math and science textbooks have the same minimum price.
(B) Both math and science textbooks have the same maximum price.
(C) The median of the price of math textbooks is less than that of science textbooks.
(D) The interquartile range of the price of math textbooks is less than that of science textbooks.
(E) The range of the price of math textbooks is less than that of science textbooks.
▶️ Answer/Explanation
Why (D) must be true
From the corrected stemplot, the middle 50% of math prices (between \(Q_1\) and \(Q_3\)) occupies a shorter run of stems/leaves than the middle 50% for science, so the IQR for math is smaller.
The plot does not force the minimums, maximums, or medians to be equal or ordered without additional marking; only the relative central spread is clear.
Answer: (D) The IQR of math prices is less than that of science prices.

Question

A car rental agency has two locations in a city. The boxplots below summarize the miles driven for one day of single-day car rentals at each location.
Based on the boxplots, which statement provides the best comparison of the two locations?
(A) The number of single-day rentals is greater for location A than for location B.
(B) The number of single-day rentals is less for location A than for location B.
(C) Compared with location A, the miles driven for location B display more variability, and the median is greater.
(D) Compared with location A, the miles driven for location B display less variability, and the median is greater.
(E) Compared with location A, the miles driven for location B display less variability, and the median is about the same.
▶️ Answer/Explanation
Detailed solution

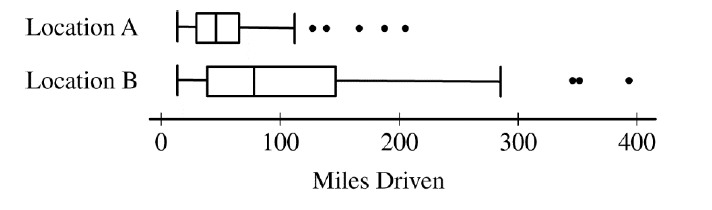
Boxplots do not show the number of observations, so (A) and (B) cannot be determined from the plots.
Compare variability using IQR and overall range: Location B’s IQR is much larger than A’s (about \(120\) vs. \(50\)), and B’s range is also larger (whiskers/outliers extend farther). Therefore B shows more variability.
Compare medians: Location B’s median (about \(80\)) is greater than Location A’s (about \(50\)).
Hence, B has more variability and a larger median.
Answer: (C)

Scroll to Top