Home / AP® Exam / AP® Statistics / AP Statistics 2.6 Linear Regression Models MCQs

AP Statistics 2.6 Linear Regression Models MCQs - Exam Style Questions

Question

The normal curve shown represents the sampling distribution of a sample mean for sample size $n = 25$, selected at random from a population with standard deviation $\sigma_x$.
Which of the following is the best estimate of the standard deviation of the population, $\sigma_x$?
(A) 3
(B) 6
(C) 15
(D) 30
(E) 75
▶️ Answer/Explanation
Detailed solution

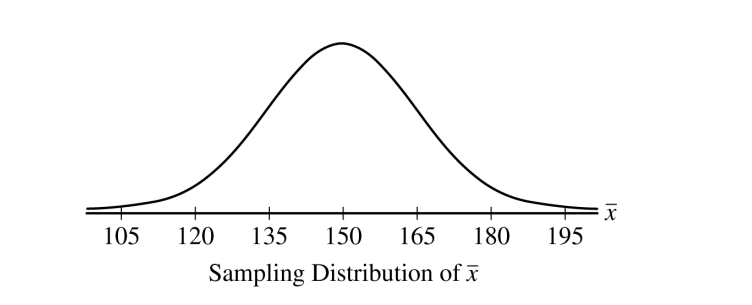
1. Estimate the standard deviation of the sampling distribution ($\sigma_{\bar{x}}$):
The range of the curve is from 105 to 195, centered at 150. This range represents approximately 3 standard deviations above and below the mean.
Distance from mean to end: $195 – 150 = 45$
So, $3\sigma_{\bar{x}} \approx 45$, which means $\sigma_{\bar{x}} \approx 15$.

2. Calculate the population standard deviation ($\sigma_x$):
The formula relating the two is $\sigma_{\bar{x}} = \frac{\sigma_x}{\sqrt{n}}$.
Rearranging the formula: $\sigma_x = \sigma_{\bar{x}} \times \sqrt{n}$.

3. Substitute and solve:
$\sigma_x \approx 15 \times \sqrt{25}$
$\sigma_x \approx 15 \times 5 = 75$
Answer: (E)

Question

A survey of a random sample of \(1,045\) young adults found that \(60\) percent do not have a landline telephone number. A hypothesis test will be used to determine whether the data provide convincing statistical evidence that more than \(50\) percent of all young adults do not have a landline telephone number. Which of the following is the test statistic for the appropriate test?
(A) \(\frac{0.50-0.60}{\sqrt{\frac{(0.50)(0.50)}{1,045}}}\)
(B) \(\frac{0.50-0.60}{\sqrt{\frac{(0.40)(0.60)}{1,045}}}\)
(C) \(\frac{0.60-0.50}{\sqrt{\frac{(0.50)(0.50)}{1,045}}}\)
(D) \(\frac{0.60-0.50}{\sqrt{\frac{(0.40)(0.60)}{1,045}}}\)
(E) \(\frac{0.60-0.50}{\frac{(0.40)(0.60)}{\sqrt{1,045}}}\)
▶️ Answer/Explanation
Detailed solution

1. Identify the Test and Parameters:
This is a one-sample z-test for a proportion.
– Null Hypothesis: \(H_0: p = 0.50\)
– Sample Proportion: \(\hat{p} = 0.60\)
– Sample Size: \(n = 1,045\)

2. State the Test Statistic Formula:
\(z = \frac{\hat{p} – p_0}{\sqrt{\frac{p_0(1-p_0)}{n}}}\)

3. Substitute Values:
The numerator is the sample statistic minus the null hypothesis value: \(0.60 – 0.50\). The standard error in the denominator must use the null hypothesis proportion, \(p_0=0.50\).
\(z = \frac{0.60 – 0.50}{\sqrt{\frac{(0.50)(1-0.50)}{1,045}}}\)

This matches the structure of option (C).
Answer: (C)

Scroll to Top