▶️ Answer/Explanation
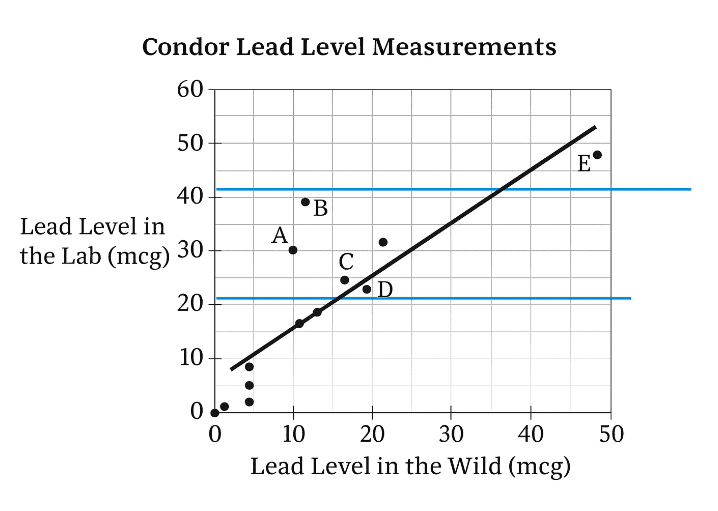
A point has a positive residual when \(e=y-\hat y>0\), i.e., the point lies above the regression line.
The requirement \(\,20\le \hat y \le 40\,\) means the point’s vertical projection onto the regression line (its predicted value) falls between the horizontal lines \(y=20\) and \(y=40\).
Inspecting the labeled points:
• \(A\): \(\hat y\) is just below \(20\) mcg (outside the band) → exclude.
• \(B\): \(\hat y\) is between \(20\) and \(40\), but the point appears close to or slightly on/above the line; however \(A\) being outside already, we check others.
• \(C\): \(\hat y\approx 25\)–\(30\) mcg (within \(20\)–\(40\)), and the point is clearly above the line → \(e>0\).
• \(D\): \(\hat y\approx 22\)–\(25\) mcg (within band), but the point is below the line → \(e<0\).
• \(E\): \(\hat y\approx 50\) mcg (greater than \(40\)) → exclude.
Therefore the only labeled point satisfying both conditions is \(C\).
✅ Answer: (C)
▶️ Answer/Explanation
Detailed solution
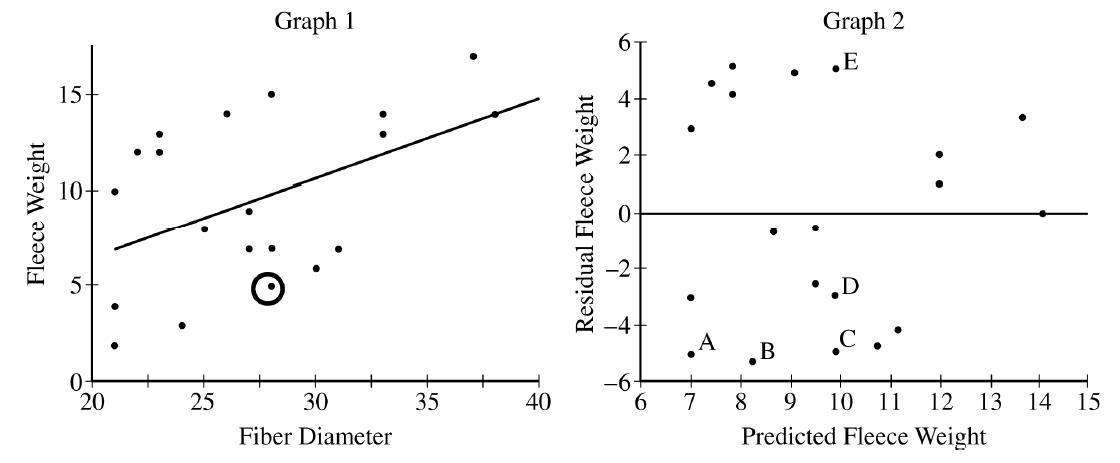
Residual \(=\) observed \(-\) predicted.
From Graph 1, the circled point has fiber diameter \(\approx 26\), predicted fleece weight \(\approx 10\), and observed fleece weight \(\approx 5\).
Residual \(\approx 5-10=-5\).
In Graph 2 (residuals vs. predicted), we need the point near \((10,\,-5)\).
Point C is at predicted \(\approx 10\) with residual \(\approx -5\).
✅ Answer: (C)
(A) Predicted \(\approx 7\) (not \(\approx 10\)).
(B) Predicted \(\approx 8\) (not \(\approx 10\)).
(D) Predicted \(\approx 10\) but residual \(\approx -3\) (not \(-5\)).
(E) Predicted \(\approx 10\) but residual \(\approx +5\) (not \(-5\)).