Predicting Population Size, Density & Distribution Using Data
🌱 Introduction
Populations are not estimated by guessing.
Ecologists collect data from the field and then use that data to predict how many organisms are present, how crowded they are, and how they are spread in an area.
🧬 Population and Related Terms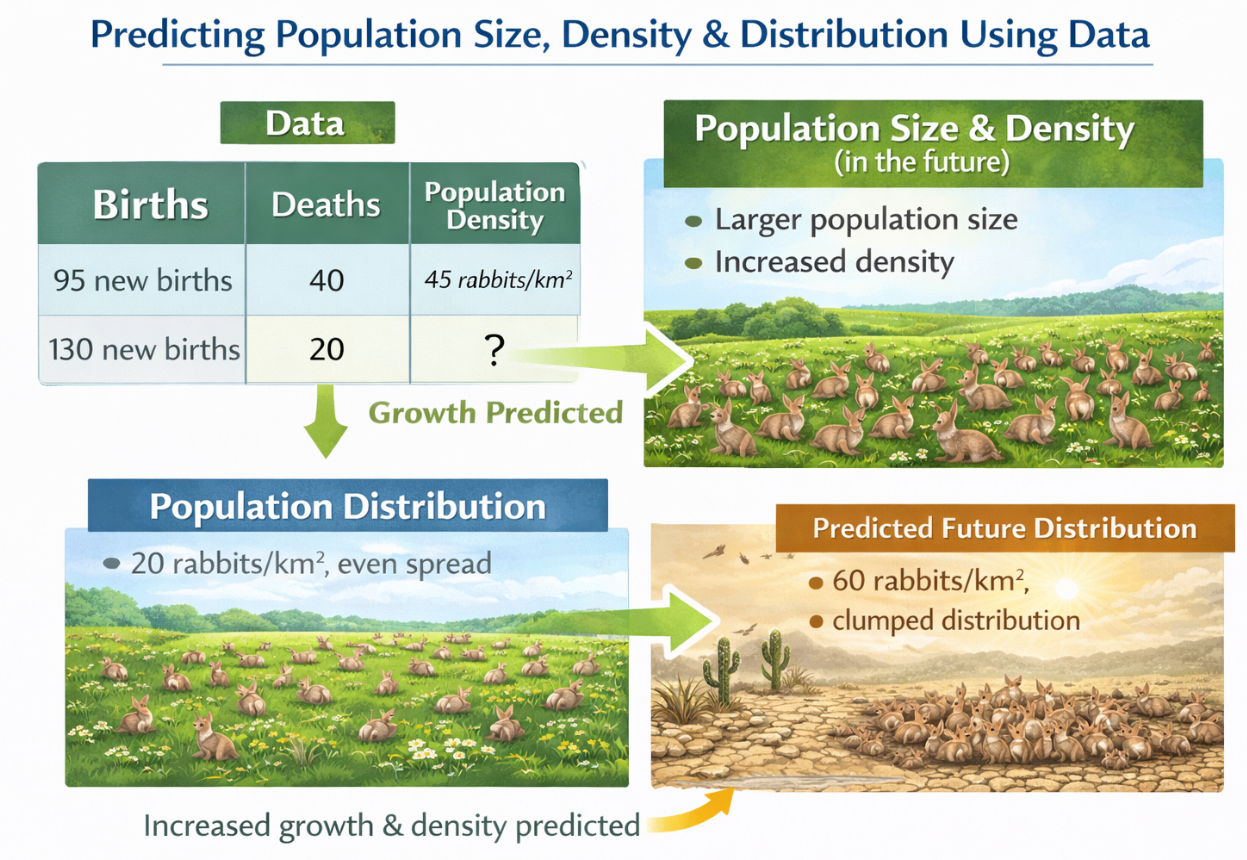
Population
A population is a group of individuals of the same species living in a specific area at a given time.
Population Size
Population size refers to the total number of individuals of a species present in an area.
Example
- 200 fish in a lake
- 1,000 trees in a forest
Population Density
Population density is the number of individuals per unit area or volume.
Formula
Population density = Number of individuals ÷ Area
Example
- 25 plants per square meter
Density helps us understand how crowded a population is.
Population Distribution
Population distribution describes how individuals are spaced within an area.
📊 Methods of Collecting Population Data
Quadrat Method
- Used for plants and slow-moving organisms.
- A square frame called a quadrat is placed randomly.
- Individuals inside the quadrat are counted.
Helps estimate population density and size.
Mark-Recapture Method
- Used for mobile animals.
- A sample is captured, marked, and released.
- After some time, another sample is captured.
- Number of marked individuals is recorded.
Used to estimate total population size.
Direct Observation
- Used for large or clearly visible organisms.
- Animals are counted along paths or fixed points.
📈 Using Data to Predict Population
Collected data is arranged in:
- Tables
- Graphs
Trends are observed over time.
Examples
- Increase in food → increase in population size
- Increase in predators → decrease in population density
- Loss of habitat → change in distribution
Predictions are made by linking data with ecological logic.
📌 Types of Population Distribution
Clumped Distribution
- Individuals are found in groups.
- Most common pattern.
- Occurs due to social behavior or uneven resources.
Example
- Herds of animals, fish schools
Uniform Distribution
- Individuals are evenly spaced.
- Caused by competition or territorial behavior.
Example
- Nesting seabirds
Random Distribution
- Individuals are spaced without a clear pattern.
- Occurs when resources are abundant.
Example
- Wildflowers in a meadow
📊 Summary Table
| Aspect | Meaning |
|---|---|
| Population size | Total number of individuals |
| Population density | Individuals per unit area |
| Population distribution | Pattern of spacing |
📦 Quick Recap
Population data is used to make predictions.
Population size → how many
Population density → how crowded
Population distribution → how spaced
Environmental Changes and Resource Availability
🌱 Introduction
Environment is never constant.
Changes in climate and physical conditions directly affect the availability of resources in an ecosystem.
To understand these effects clearly, ecologists use models such as diagrams, graphs, and flow charts.
🧬 What are Environmental Changes?
Environmental changes are natural or human-caused alterations in an ecosystem.
Common examples
- Climate change
- Drought
- Flood
- Fire
- Habitat destruction
These changes can be short-term or long-term.
🌡️ Effect on Abiotic Resources
Abiotic resources are non-living components of the environment.
Major abiotic resources affected
- Sunlight
- Water
- Temperature
- Soil nutrients
- Oxygen availability
How changes affect them
- Drought reduces water availability
- Floods reduce oxygen in soil
- Fire increases soil minerals temporarily
- Climate change alters temperature ranges
Change in abiotic resources sets new survival limits for species.
🐾 Effect on Biotic Resources
Biotic resources involve living organisms and interactions.
Major biotic resources affected
- Food availability
- Number of predators
- Availability of mates
- Competition within population
How changes affect them
- Drought reduces plant growth → less food for herbivores
- Fire may reduce predator populations temporarily
- Habitat loss increases competition for limited resources
Biotic resource changes affect survival and reproduction.
📊 Using Models to Explain These Changes
Models help visualize cause and effect.
Common models used
- Flow diagrams
- Food web models
- Population graphs
- Energy pyramids
📉 Example Model Explanation (Drought)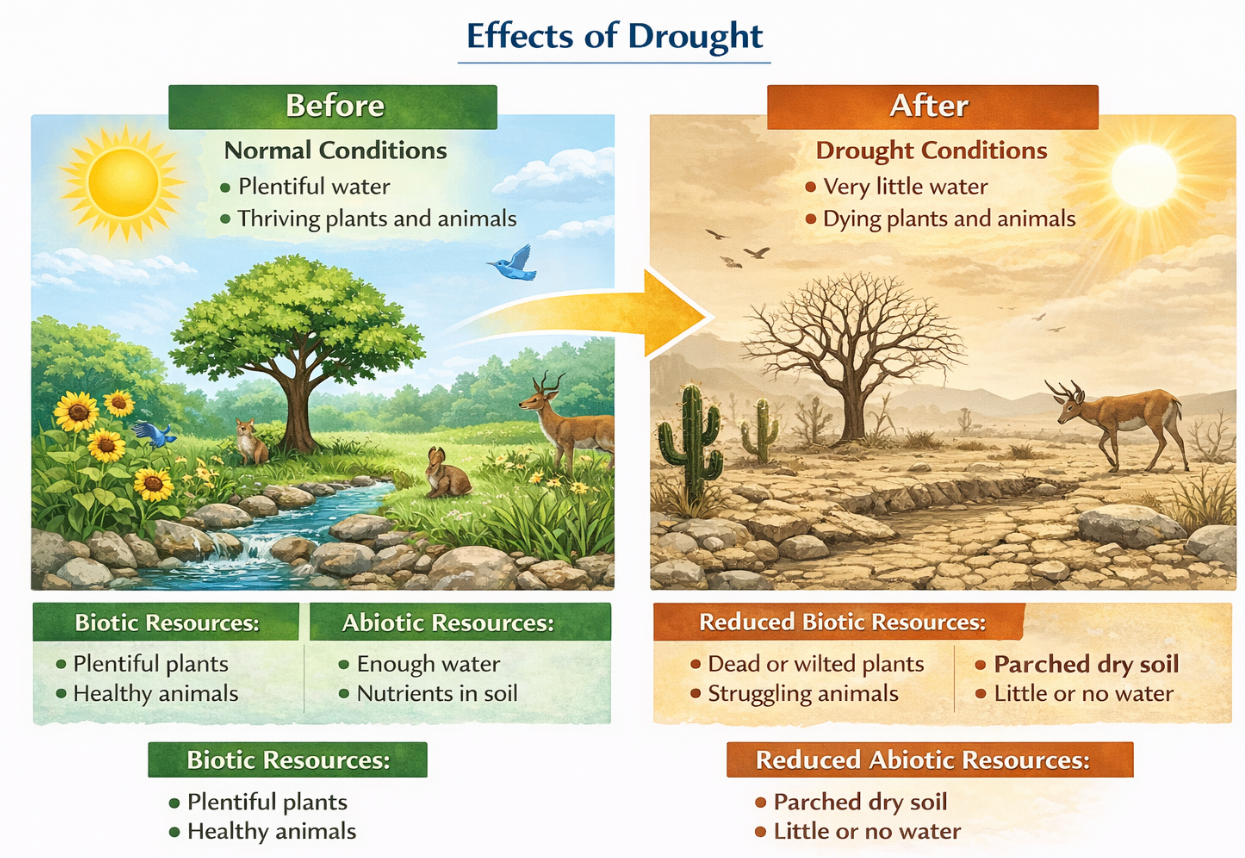
Environmental change
Prolonged drought
Abiotic effect
Reduced water and soil moisture
Biotic effect
Decreased plant growth
Population outcome
- Herbivore population declines
- Predator population also declines
One abiotic change causes a chain reaction.
📈 Example Model Explanation (Climate Warming)
Environmental change
Increase in temperature
Abiotic effect
Shift in suitable temperature range
Biotic effect
Species migrate or compete for new areas
Population outcome
Change in population distribution
📊 Summary Table
| Environmental Change | Abiotic Resource Affected | Biotic Impact |
|---|---|---|
| Drought | Water | Reduced food |
| Flood | Oxygen | Plant death |
| Fire | Soil nutrients | Population shift |
| Climate change | Temperature | Migration |
🧠 Simple Model Rule
Change → Resource → Population
Remember:
- Environmental change alters resources
- Resource availability controls population
📦 Quick Recap
Environmental changes affect ecosystems.
Abiotic resources include water, temperature, and nutrients.
Biotic resources include food, mates, and competition.
Models show cause–effect relationships.
Change in resources leads to population change