Using Data to Explain Population Growth
🌱 Introduction
Population growth means change in population size over time.
Ecologists do not explain this change by guessing. They use data collected over different time periods and represent it using tables, graphs, and models.
🧬 What is Population Growth?
Population growth refers to the increase or decrease in the number of individuals in a population over time.
Growth depends on:
- Birth rate
- Death rate
- Immigration
- Emigration
These factors together decide population size.
📊 Types of Population Data Used
Population growth is explained using numerical data such as:
- Number of individuals recorded each year
- Birth and death rates
- Changes in population over time
This data is commonly shown in:
- Tables
- Line graphs
- Bar graphs
📈 Population Growth Graphs
Exponential Growth Pattern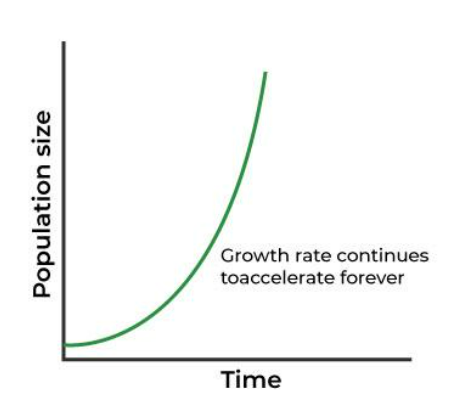
Occurs when:
- Resources are abundant
- Environmental conditions are ideal
Population increases rapidly over time.
Graph shows a J-shaped curve.
What data shows
- Each time interval shows a faster increase than the previous one.
Example
- Bacteria growing in fresh nutrient medium.
Logistic Growth Pattern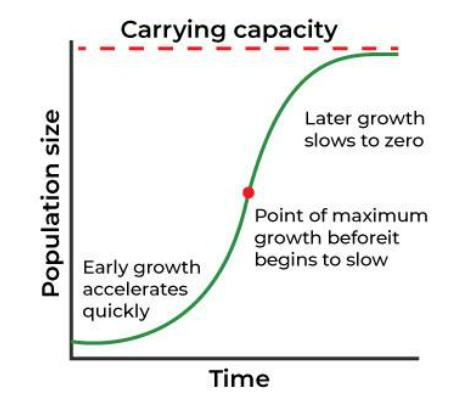
Occurs when:
- Resources become limited
- Population growth slows down after a point.
Graph shows an S-shaped curve.
What data shows
- Rapid increase at first
- Slower growth later
- Population stabilises around carrying capacity.
📉 Explaining Population Changes Using Data
By analysing data, we can explain:
- Why population increased
- Why population decreased
- Why population stabilised
Example
- Increase in population data → high birth rate
- Decline in population data → increased death rate or emigration
- Stable population data → balance between births and deaths
📏 Growth Rate from Data
Population growth rate shows how fast a population is changing.
It is calculated using:
- Change in population size
- Time interval
Higher slope in graph = faster growth rate.
📊 Using Data to Identify Growth Phases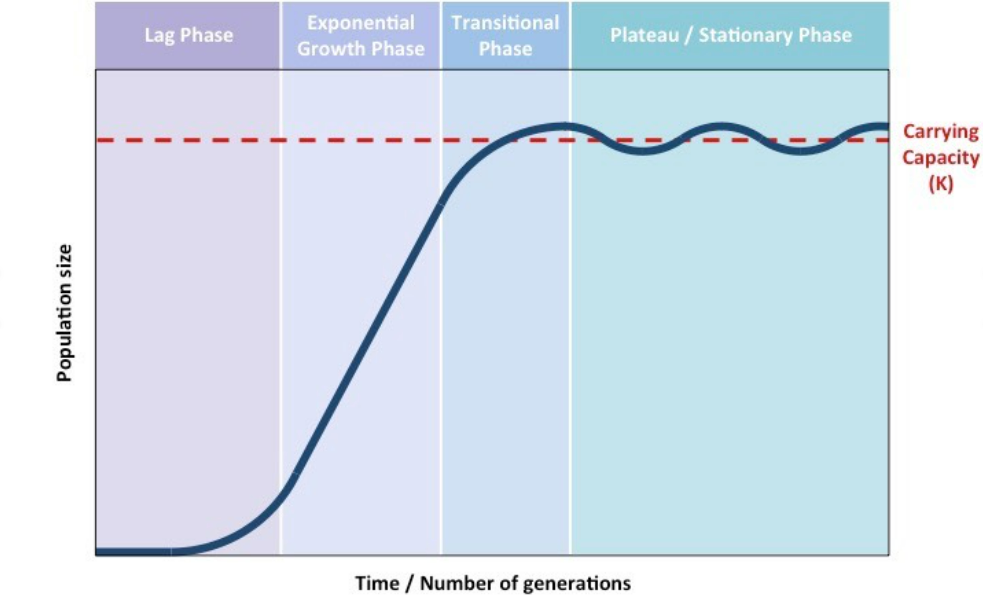
Population data often shows below phases:
Lag phase
- Slow growth
- Population adapting
Exponential phase
- Rapid growth
- High reproduction
Stationary phase
- Growth slows
- Resources become limiting
📊 Sample Data Interpretation
If population data shows:
- Rapid rise → exponential growth
- Rise followed by plateau → logistic growth
- Repeated ups and downs → fluctuating population
Always explain why the pattern occurs using resource availability.
📊 Summary Table
| Data Pattern | Growth Explanation |
|---|---|
| Steep increase | High growth rate |
| Plateau | Carrying capacity reached |
| Decline | Increased mortality |
| Fluctuation | Resource variation |
📦 Quick Recap
Population growth is explained using data.
Data includes population size over time and birth–death rates.
Graphs help identify exponential and logistic growth.
Slope of graph shows growth rate.
Data trends explain population changes
Relationship Between Resource Availability and Population Growth Pattern
🌱 Introduction
Population growth is directly controlled by resources.
When resources are plenty, populations grow rapidly.
When resources become limited, growth slows down or stops.
🧬 What Are Resources?
Resources are factors needed for survival and reproduction.
They include:
- Food
- Water
- Space
- Nutrients
- Shelter
The amount of available resources decides how a population grows.
📈 Unlimited Resources and Growth Pattern
When resources are abundant and unlimited:
- Birth rate remains high
- Death rate remains low
- Competition is minimal
Growth Pattern
- Population shows exponential growth
- Growth rate increases rapidly with time
This situation is rare and usually temporary.
📉 Limited Resources and Growth Pattern
When resources become limited:
- Competition increases
- Birth rate decreases
- Death rate increases
Growth Pattern
- Population growth slows down
- Population stabilises near a limit
This leads to logistic growth.
⚖️ Carrying Capacity and Resources
Carrying capacity is the maximum population size that an environment can support.
It depends on:
- Amount of food
- Water availability
- Space
When population reaches carrying capacity:
- Growth rate becomes zero
- Birth rate equals death rate
🔁 Fluctuating Resources and Population
Resources are not constant.
They change due to:
- Seasonal variation
- Climate change
- Natural disturbances
Effect on population
- Population size fluctuates
- Growth curve shows small rises and falls around carrying capacity
📌 Limiting Resources
Sometimes one single resource limits growth.
Examples
- Nitrogen limiting plant growth
- Water limiting desert populations
Even if all other resources are sufficient, population growth stops.
📊 Summary Table
| Resource Availability | Growth Pattern |
|---|---|
| Abundant | Exponential growth |
| Gradually limited | Logistic growth |
| Severely limited | Population decline |
| Fluctuating | Population fluctuation |
🧠 Simple Memory Line
More resources → faster growth
Less resources → slower growth
📦 Quick Recap
Resource availability controls population growth.
Unlimited resources lead to exponential growth.
Limited resources lead to logistic growth.
Carrying capacity depends on available resources.
A single limiting resource can stop growth.
Changing resources cause population fluctuations
How Competition for Resources Shapes Populations
🌱 Introduction
Resources in nature are always limited.
When the number of individuals increases, organisms begin to compete for the same resources.
This competition plays a major role in controlling population size, growth rate, and survival.
🧬 What is Competition?
Competition occurs when two or more organisms require the same limited resource.
It can occur:
- Within the same species
- Between different species
Competition increases as population size increases.
🌱 Types of Competition
Intraspecific Competition
Occurs within the same species.
Individuals compete for:
- Food
- Water
- Space
- Mates
Effect
- Stronger individuals survive and reproduce.
- Weaker individuals may die or migrate.
Interspecific Competition
Occurs between different species.
Species compete for similar resources.
Effect
- One species may outcompete the other.
- Population size of one or both species may decrease.
📉 Effect of Competition on Population Growth
As competition increases: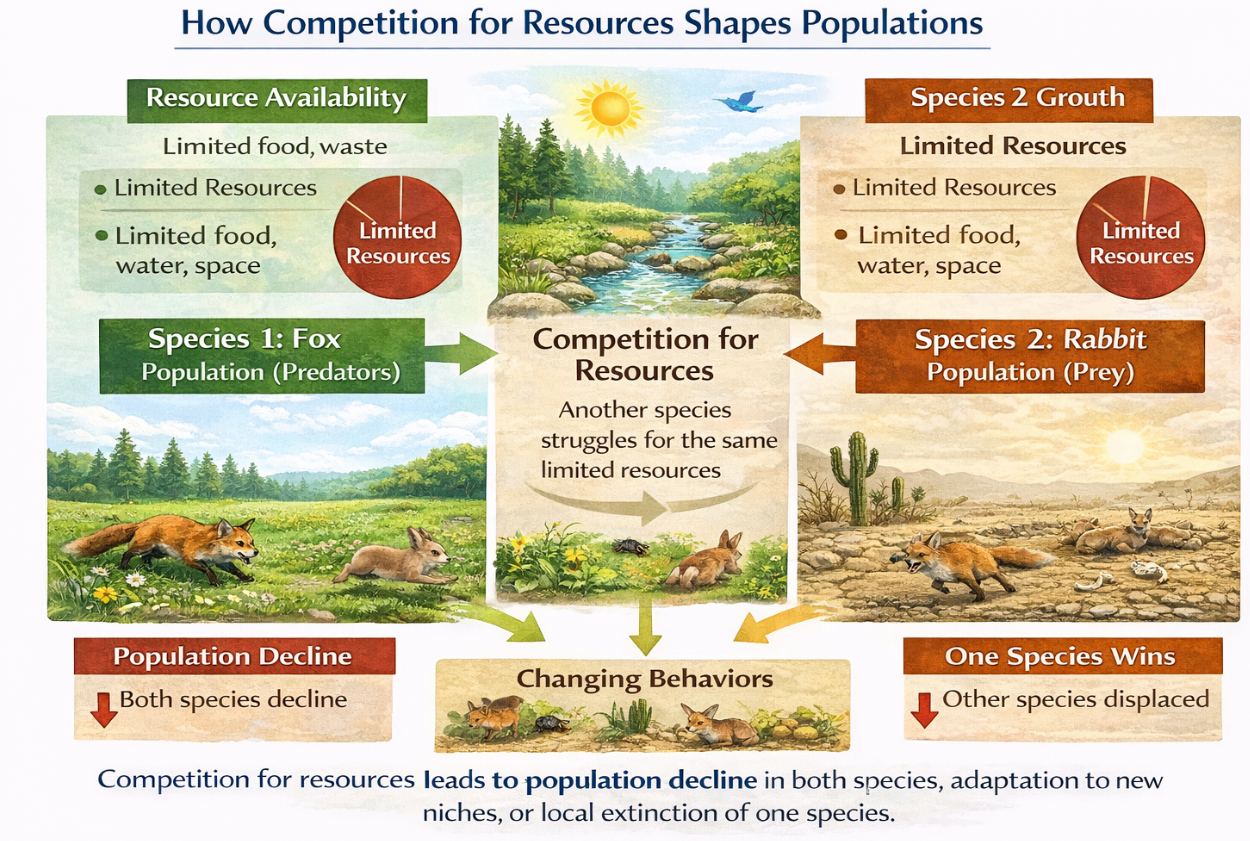
- Birth rate decreases
- Death rate increases
- Growth rate slows
Population growth becomes density-dependent.
⚖️ Competition and Carrying Capacity
Carrying capacity depends on resource availability.
When population exceeds carrying capacity:
- Competition becomes intense
- Population size declines
Competition keeps population size near carrying capacity.
📌 Competition Shapes Population Structure
Competition influences:
- Population size
- Population density
- Population distribution
Examples
- Territorial animals show uniform distribution.
- Plants competing for light grow taller or die.
🌱 Competition as a Natural Regulator
Competition:
- Prevents unlimited population growth.
- Ensures balanced resource use.
- Promotes survival of best-adapted individuals.
Competition is essential for ecosystem stability.
📊 Summary Table
| Aspect | Effect of Competition |
|---|---|
| Population size | Limits growth |
| Birth rate | Decreases |
| Death rate | Increases |
| Distribution | Becomes uniform or clumped |
| Carrying capacity | Maintained |
📦 Quick Recap
Competition occurs due to limited resources.
Intraspecific competition occurs within the same species.
Interspecific competition occurs between different species.
Competition slows population growth and regulates population size.
Competition helps maintain carrying capacity