Transfer of Energy Through the Food Web of a Community
🌱 Introduction
Every ecosystem runs on energy.
Energy enters the ecosystem from the Sun and then moves through organisms by feeding interactions.
Because energy cannot be reused or recycled, it must be constantly transferred from one organism to another.
To explain this transfer clearly, scientists use models like food chains, food webs, and energy pyramids.
🌱 What is Energy Transfer in a Community?
A community includes all populations of different species living together.
Energy transfer refers to the movement of energy from one organism to another through feeding.
Important point
- Energy flow is one-way
- Energy enters as sunlight and leaves as heat
 🌱 Entry of Energy into Ecosystem
The Sun is the main source of energy for most ecosystems.
- Primary producers capture sunlight through photosynthesis.
- Chemical energy is stored in food molecules like glucose.
Without producers, no energy enters the food web.
🌱 Trophic Levels in a Food Web
Energy moves through different trophic levels.
1. Primary Producers
- Plants, algae, phytoplankton
- Convert solar energy into chemical energy
- Form the base of the food web
2. Primary Consumers
- Herbivores
- Obtain energy by eating producers
3. Secondary Consumers
- Carnivores or omnivores
- Feed on herbivores
4. Tertiary Consumers
- Top predators
- Feed on secondary consumers
Each transfer results in energy loss.
🌱 Food Chain Model
A food chain shows a single linear pathway of energy transfer.
Example
Grass → Deer → Lion
What it explains
- Direction of energy flow
- Simple understanding of feeding
Limitation
- Does not show real ecosystem complexity
🌱 Food Web Model
A food web is a network of interconnected food chains.
Shows multiple feeding relationships in a community.
Why food webs are important
- One organism can have multiple food sources
- One organism can be eaten by multiple predators
- Makes ecosystem more stable
Example
- Grass eaten by deer, rabbit, grasshopper
- Rabbit eaten by fox and hawk
Energy flows through many pathways, not just one.
🌱 Energy Pyramid Model
An energy pyramid shows the amount of energy present at each trophic level.
Shape is always upright.
Key points
- Maximum energy at producer level
- Energy decreases at each higher level
- Pyramid never inverted for energy
Reason
- Energy is lost during transfer
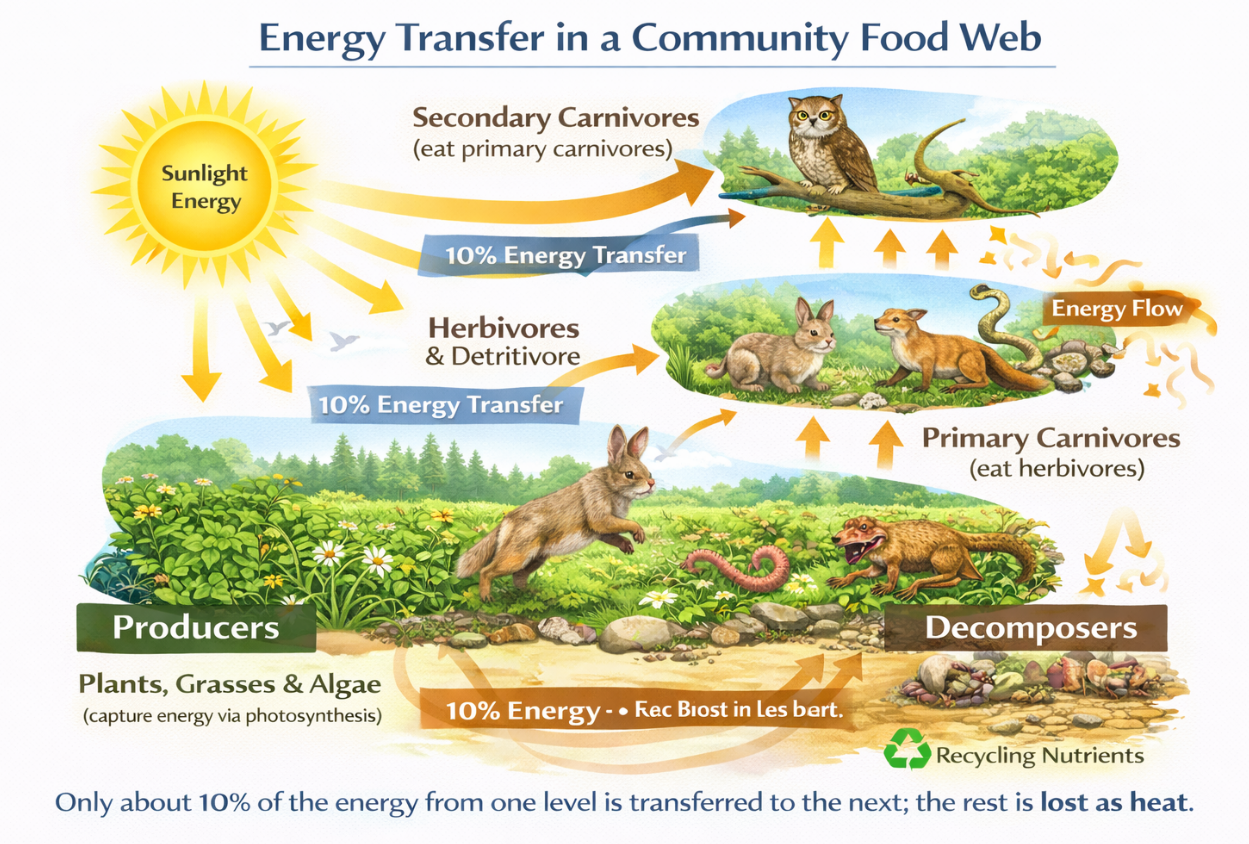
🌱 10 Percent Law of Energy Transfer
Only about 10 percent of energy from one trophic level is passed to the next.
Remaining 90 percent is:
- Used for respiration
- Used for movement and growth
- Lost as heat
Example
- Producers have 10,000 units of energy
- Primary consumers get 1,000 units
- Secondary consumers get 100 units
This limits the length of food chains.
🌱 Loss of Energy as Heat
Organisms use energy for:
- Metabolism
- Maintenance
- Reproduction
During these activities, energy is released as heat.
Important point
- Heat energy cannot be reused
- Energy is not recycled, only transferred
🌱 Role of Decomposers in Energy Flow
Decomposers break down dead plants and animals.
- They recycle nutrients, not energy.
- Energy stored in dead matter is eventually released as heat.
Decomposers complete nutrient cycles but energy exits the ecosystem.
🌱 Why Energy Transfer Models Matter
Models help us:
- Visualize energy movement
- Understand ecosystem stability
- Predict effects of species loss
Example
- Removal of producers collapses the entire food web
- Removal of top predators causes imbalance
🌱 Summary Table
| Model | Purpose |
|---|---|
| Food chain | Single energy pathway |
| Food web | Multiple energy pathways |
| Energy pyramid | Amount of energy at each level |
📦 Quick Recap
Energy enters ecosystem as sunlight
Producers capture energy
Energy flows one-way through trophic levels
Only 10 percent energy transfers upward
Most energy is lost as heat
Food webs show real ecosystem connections
Using Species Distribution Data to Predict Resource Availability
🌱 Introduction
Organisms are not distributed randomly in an ecosystem.
The presence, absence, or abundance of species in an area gives strong clues about which resources are available there.
By analyzing species distribution data, ecologists can predict the availability of energy and other resources in that environment.
🌱 What is Species Distribution?
Species distribution refers to where organisms are found and how many are present in different areas.
It includes:
- Geographic location
- Population density
- Distribution pattern
Distribution reflects resource availability and environmental conditions.
🌱 Types of Distribution Patterns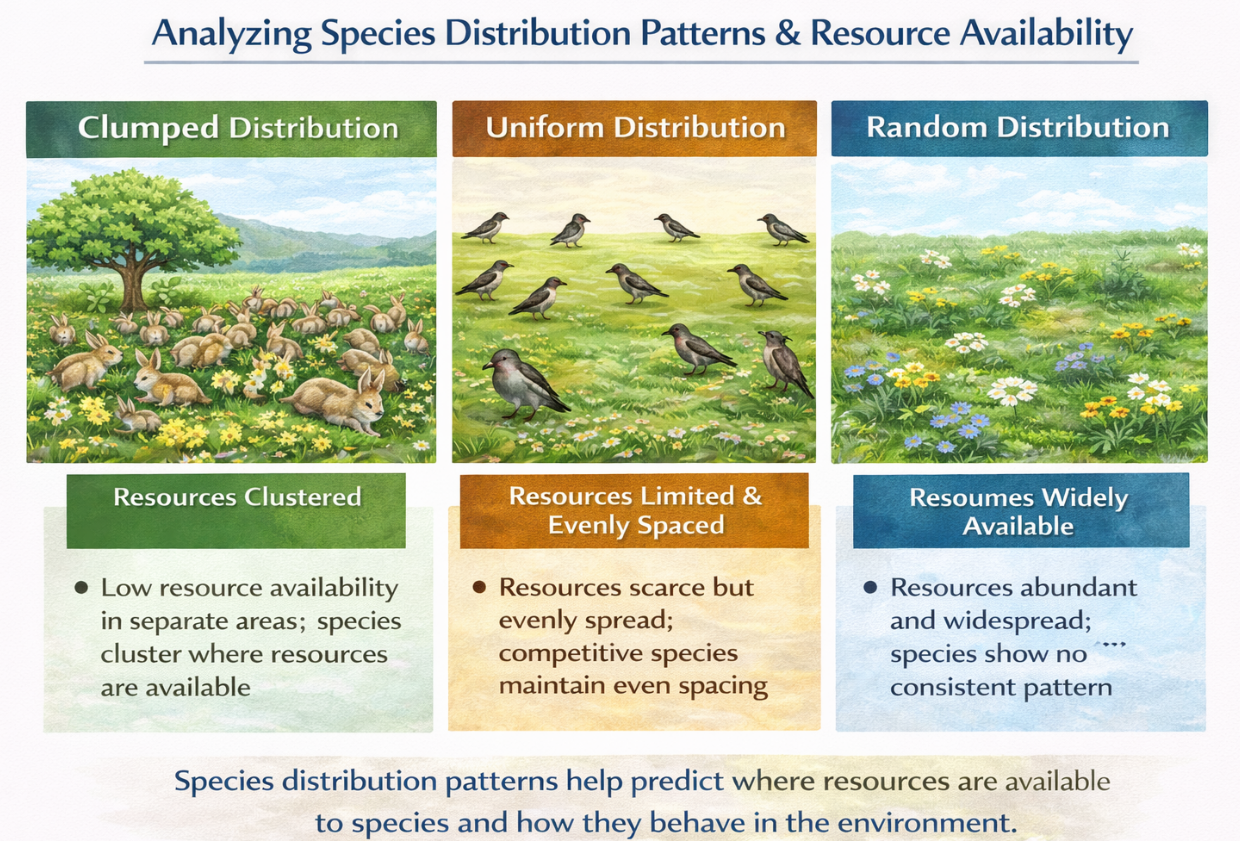
Clumped Distribution
- Individuals occur in groups.
- Usually indicates patchy resources or social behavior.
Resource clue
Resources are unevenly distributed.
Uniform Distribution
- Individuals are evenly spaced.
- Often caused by competition for limited resources or territorial behavior.
Resource clue
Resources are limited but evenly available.
Random Distribution
- Individuals are unpredictably spaced.
- Occurs when resources are abundant and competition is low.
Resource clue
Resources are widely and evenly available.
🌱 Using Population Density Data
High population density usually indicates:
- High food availability
- Favorable abiotic conditions
Low population density may indicate:
- Limited resources
- High predation
- Harsh conditions
Density data helps estimate resource abundance.
🌱 Analyzing Distribution Across Trophic Levels
Large producer populations indicate:
- High energy input
- Adequate sunlight and nutrients
Fewer predators indicate:
- Limited energy at higher trophic levels
Energy availability decreases upward.
🌱 Using Data Tables and Graphs
When given data, look for:
- Areas with maximum species abundance
- Areas where populations decline sharply
Prediction examples
- More herbivores → abundant vegetation
- Decline in fish → low oxygen or pollution
- Increase in predators → sufficient prey availability
🌱 Resource Prediction Using Indicator Species
Some species survive only under specific conditions.
Their presence indicates availability of certain resources.
Examples
- Lichens indicate clean air
- Amphibians indicate water availability
These species help predict resource quality.
📊 Summary Table
| Distribution Observation | Resource Prediction |
|---|---|
| High density | High resource availability |
| Clumped pattern | Patchy resources |
| Uniform pattern | Limited resources |
| Predator presence | Adequate prey |
| Producer abundance | High energy input |
📦 Quick Recap
Species distribution reflects resources.
Clumped distribution indicates patchy resources.
Uniform distribution indicates limited resources.
Random distribution indicates abundant resources.
High density suggests more resources, low density suggests limitation.
Distribution data helps predict energy and resource availability
Predicting Energy Distribution in an Ecosystem Based on Energy Available to Organisms
🌱 Introduction
Every ecosystem runs on energy.
But this energy is limited and unevenly distributed among organisms.
It focuses to use available energy data to predict:
- How much energy each trophic level gets
- How many organisms can be supported
- Why higher trophic levels are fewer
Core idea:
Energy availability controls ecosystem structure.
🧬 Entry of Energy into Ecosystem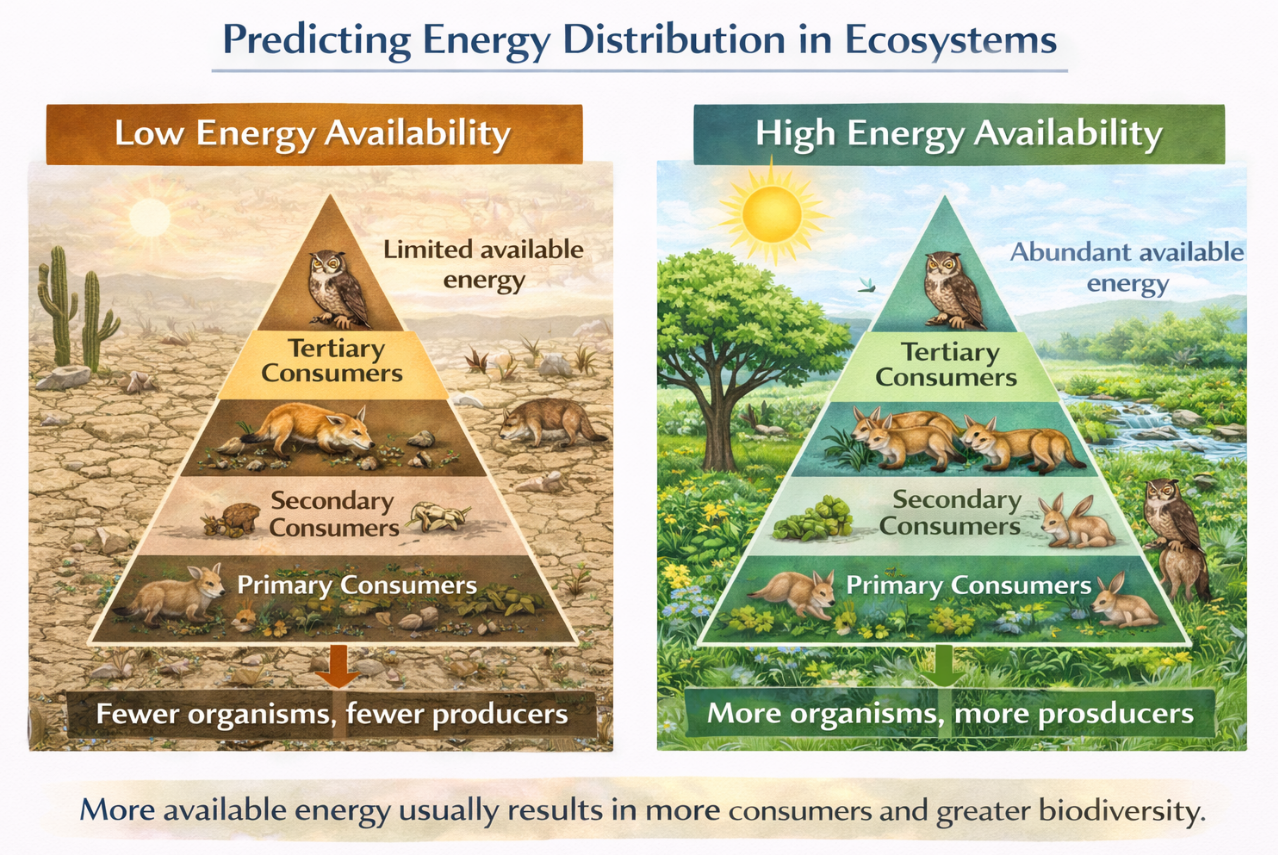
- Sunlight is the ultimate source of energy
- Captured only by producers through photosynthesis
- Converted into chemical energy (glucose)
📌 Important points:
- Only a small fraction (1–2%) of solar energy is captured
- This captured energy becomes the energy budget of the ecosystem
If sunlight availability is low:
- Total ecosystem energy becomes low
- Fewer organisms can survive
🔑 Producers: Energy Foundation
Producers include:
- Green plants
- Algae
- Phytoplankton
They form the base of all food chains.
Why producers have maximum energy:
- They directly trap solar energy
- No prior energy loss
Prediction:
- More producer energy → larger ecosystem support
- Less producer energy → weak food chains
🧠 Trophic Levels and Energy Transfer
Energy flows through trophic levels:
- Producers
Maximum energy
Highest productivity - Primary consumers (Herbivores)
Feed on producers
Receive reduced energy - Secondary consumers
Feed on herbivores
Energy further decreases - Tertiary consumers / Apex predators
Top level
Least energy available
📌 Energy flow is:
- Unidirectional
- Non-cyclic
- Always accompanied by energy loss
⚡ 10% Law of Energy Transfer
Only about 10% of energy passes to the next trophic level.
Remaining 90% is lost as:
- Heat
- Respiration
- Movement
- Excretion
- Undigested material
Example prediction:
- Producers: 20,000 J
- Primary consumers: 2,000 J
- Secondary consumers: 200 J
- Tertiary consumers: 20 J
🧠 Memory Tip:
Ten percent travels, ninety percent vanishes
🌍 Energy Pyramid and Predictions
An energy pyramid shows energy at each trophic level.
- It is always upright
Why always upright:
- Energy is lost at every transfer
- Upper levels cannot have more energy than lower ones
📌 Using energy pyramid, we can predict:
- Short food chains
- Small population of top predators
- Large producer base
🌿 Predicting Energy Distribution Using Data
Given energy data, predictions include:
- High producer energy
Large producer population
More herbivores
Possible higher predators - Low producer energy
Small ecosystem
Fewer consumers
Possibly no top predators - Energy drop at any level affects all higher trophic levels
- Causes population decline
📊 Biomass vs Energy
- Biomass pyramid can sometimes be inverted
- Energy pyramid is never inverted
Reason:
- Energy flow obeys thermodynamic laws
- Energy loss is unavoidable
📋 Summary Table: Energy Distribution
| Aspect | Key Point |
|---|---|
| Energy source | Sun |
| Maximum energy | Producers |
| Transfer efficiency | About 10% |
| Energy loss | Heat, respiration, waste |
| Energy pyramid | Always upright |
| Top predators | Few in number |
📦 Quick Recap
Sun → producers → consumers
Producers control ecosystem energy
Only 10% energy passes upward
Energy decreases at higher trophic levels
Fewer organisms at top levels
Energy data helps predict ecosystem size and stability