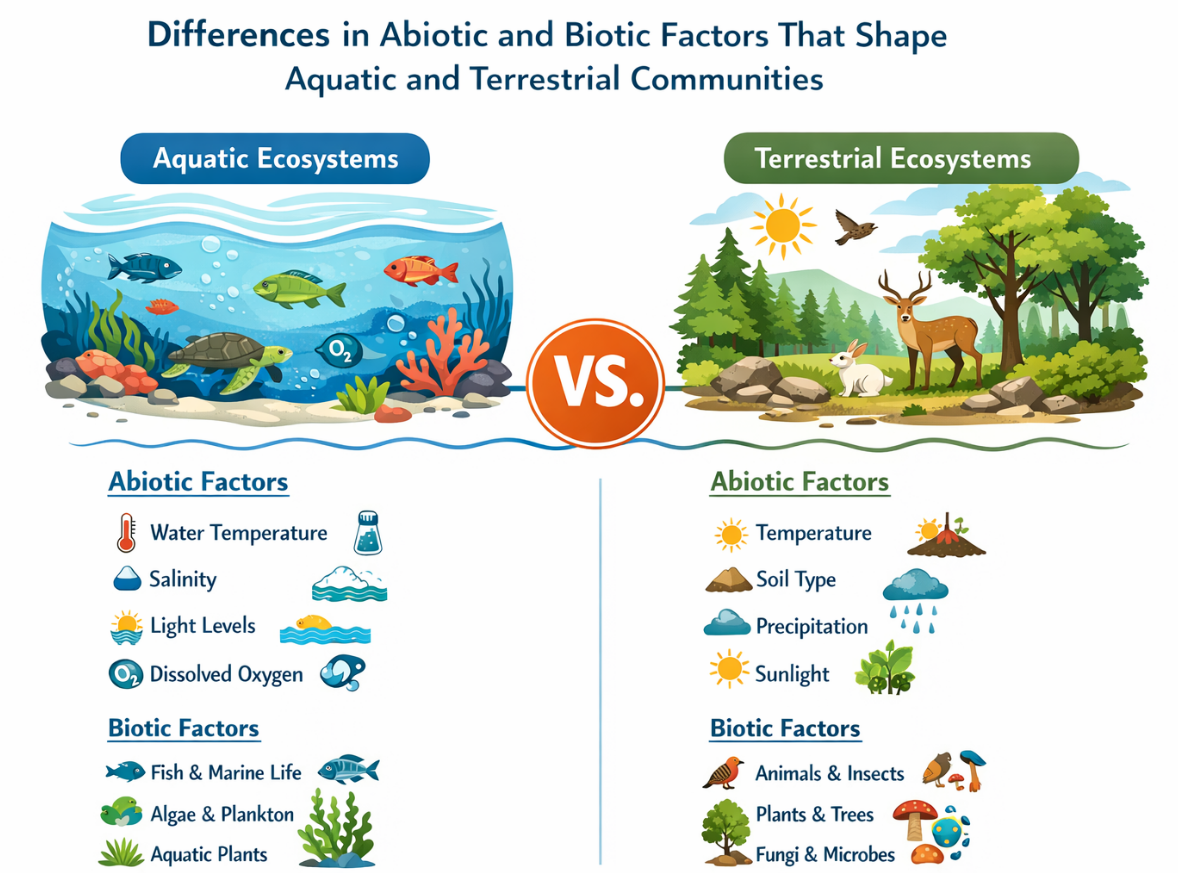
Differences in Abiotic and Biotic Factors That Shape Aquatic and Terrestrial Communities
🌱 Introduction
Every ecological community is shaped by two broad forces:
- Abiotic factors → non-living physical and chemical conditions
- Biotic factors → living organisms and their interactions
These factors decide:
- Which species can live there
- How many individuals survive
- How organisms interact with each other
🧬 Basic Definitions
📌 Abiotic Factors
Non-living environmental components that affect organisms directly.
Examples:
- Temperature
- Water availability
- Light
- Soil or salinity
- Nutrient levels
📌 Biotic Factors
Living components and interactions among organisms.
Examples:
- Plants, animals, microbes
- Competition
- Predation
- Mutualism
- Decomposition
 🌿 TERRESTRIAL COMMUNITIES
(Land-based ecosystems)
Examples:
- Forests
- Grasslands
- Deserts
- Tundra
🔑 Abiotic Factors in Terrestrial Communities
1. Climate (MOST IMPORTANT)
Climate controls entire biome structure.
Temperature
- Affects enzyme activity and metabolism
- Limits species distribution
Examples:
- Tundra → only cold-tolerant plants and animals
- Deserts → organisms adapted to heat stress
Precipitation
- Determines plant type and productivity
Examples:
- High rainfall → forests
- Moderate rainfall → grasslands
- Very low rainfall → deserts
2. Soil Type
Soil acts as the foundation for terrestrial life.
Soil properties include:
- Nutrient availability
- Water retention
- Texture (sand, clay, loam)
- pH
Examples:
- Nutrient-rich soil → dense vegetation
- Poor soil → sparse plant growth
Plants directly depend on soil, animals depend indirectly.
3. Light Availability
- Drives photosynthesis
- Influences plant height and leaf structure
Example:
- Forest canopy → limited light for ground plants
- Open grasslands → abundant sunlight
4. Wind
Affects:
- Water loss (transpiration)
- Seed dispersal
- Plant shape
Example:
- Tundra plants grow low to reduce wind damage
5. Fire (Biome-specific but Important)
- Common in grasslands and savannas
- Removes old biomass
- Recycles nutrients
Fire can maintain community structure rather than destroy it.
🧬 Biotic Factors in Terrestrial Communities
1. Plant Dominance
- Plants are primary producers
- Control food availability, habitat structure, and microclimate
Example:
- Trees create shade and humidity
- Grass roots prevent soil erosion
2. Competition
Occurs mainly for:
- Light
- Water
- Nutrients
- Space
3. Herbivory
- Animals feeding on plants
- Shapes plant defenses
4. Predation
- Controls herbivore populations
- Maintains balance in food webs
5. Decomposers
- Bacteria and fungi break down dead matter
- Return nutrients to soil
Without decomposers, nutrients would remain locked in dead bodies.
🌊 AQUATIC COMMUNITIES
(Water-based ecosystems)
Examples:
- Oceans
- Estuaries
- Rivers
- Lakes
- Wetlands
🔑 Abiotic Factors in Aquatic Communities
1. Water Depth and Light Availability
- Light penetration decreases with depth
- Photic zone → photosynthesis
- Aphotic zone → no photosynthesis
Light limits primary productivity in water.
2. Salinity
- Freshwater → low salinity
- Brackish → intermediate salinity
- Marine → high salinity
3. Temperature
- Water temperature changes slowly
- Cold water holds more oxygen
- Warm water holds less oxygen
4. Nutrient Availability
- Nitrogen and phosphorus are key
- Low nutrients → low productivity
- High nutrients → algal blooms
5. Flow Rate and Currents
- Disperse organisms
- Bring nutrients
- Shape body form
🧬 Biotic Factors in Aquatic Communities
- Plankton dominance – base of food webs
- Competition – mainly for light and nutrients
- Predation – controls population sizes
- Symbiosis – common in marine ecosystems
📊 Comparison Table: Terrestrial vs Aquatic Communities
| Feature | Terrestrial | Aquatic |
|---|---|---|
| Main medium | Air | Water |
| Major abiotic control | Climate and soil | Light, salinity, depth |
| Primary producers | Plants | Phytoplankton |
| Light limitation | Rare | Common |
| Temperature variation | High | Low |
| Nutrient cycling | Soil-based | Water-based |
📦 Quick Recap
Abiotic factors decide which species survive
Terrestrial communities depend on climate and soil
Aquatic communities depend on light, salinity, depth, and flow
Plants dominate land food webs
Plankton dominate aquatic food webs
Biotic interactions maintain balance in both systems
Using Data to Predict How Abiotic and Biotic Factors Shape an Ecological Community
🌱 Introduction
In ecology, observations alone are not enough.
Scientists collect data and analyze patterns to predict how changes in abiotic or biotic factors will affect an ecological community.
🧬 What “Using Data” Means in Ecology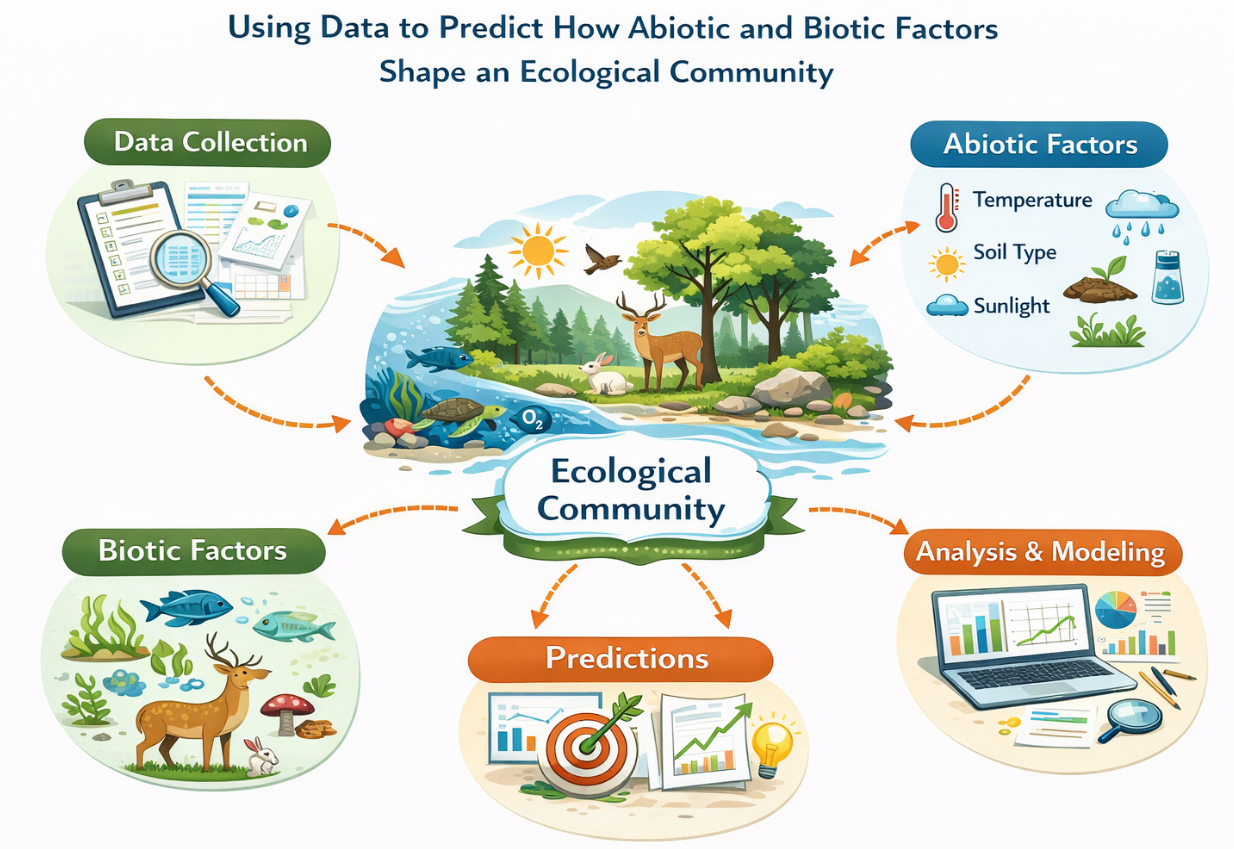
Data can include:
- Population counts
- Species richness
- Biomass
- Temperature records
- Rainfall patterns
- Nutrient levels
- Predator-prey numbers
You do not memorize the result.
You reason from the data.
🔑 General Prediction Framework
Whenever you see data, follow this order:
- Identify the changing factor (abiotic or biotic)
- Observe the trend (increase, decrease, fluctuation)
- Identify affected organisms
- Predict short-term and long-term effects
🌡 Abiotic Factors: Data-Based Predictions
1. Temperature Data
Example Data Pattern
- Average temperature increases over several years
- Species richness decreases
Interpretation
- Enzymes and metabolic rates are temperature-dependent
- Organisms have tolerance limits
Prediction
- Heat-sensitive species decline
- Heat-tolerant species increase
- Overall biodiversity decreases
📌Remember:
Rising temperatures shift species composition by favoring organisms with higher thermal tolerance.
2. Precipitation Data (Terrestrial Communities)
Example Data Pattern
- Rainfall decreases
- Plant biomass decreases
Interpretation
- Water is essential for photosynthesis and nutrient transport
Prediction
- Reduced primary productivity
- Herbivore populations decline
- Predator populations decline afterward
📌 Trophic cascade logic is expected.
3. Light Availability Data (Aquatic Communities)
Example Data Pattern
- Increasing water depth
- Decreasing photosynthetic rate
Interpretation
- Light penetration decreases with depth
Prediction
- Phytoplankton limited to surface layers
- Reduced food availability for higher trophic levels
📌 Light controls aquatic productivity.
4. Nutrient Concentration Data
Example Data Pattern
- Nitrogen and phosphorus increase in water
- Algal population increases rapidly
Interpretation
- Nutrients are limiting factors
Prediction
- Algal blooms occur
- Oxygen levels decrease due to decomposition
- Fish and invertebrates die
📌 This predicts eutrophication.
5. Salinity Data
Example Data Pattern
- Salinity increases gradually
- Freshwater species decline
Interpretation
- Osmoregulation requires energy
- Not all species tolerate salinity changes
Prediction
- Salt-tolerant species replace freshwater species
- Community composition shifts
🧬 Biotic Factors: Data-Based Predictions
1. Predator Population Data
Example Data Pattern
- Predator population increases
- Herbivore population decreases
Interpretation
- Increased predation pressure
Prediction
- Reduced grazing pressure on plants
- Plant biomass increases
📌 Classic trophic cascade.
2. Competition Data
Example Data Pattern
- One species increases while another declines
- Both use same resource
Interpretation
- Competitive exclusion
Prediction
- Dominant competitor survives
- Inferior competitor declines or migrates
3. Invasive Species Data
Example Data Pattern
- New species introduced
- Native species populations decline
Interpretation
- Lack of predators or strong competition
Prediction
- Reduced native biodiversity
- Altered food web structure
4. Mutualism Data
Example Data Pattern
- Decline in pollinators
- Reduced plant reproduction
Interpretation
- Mutual dependence
Prediction
- Plant population declines
- Species relying on those plants also decline
🌊 Case-Based Prediction Examples
Lake Ecosystem Data
- Increased fertilizer runoff
- Higher algal biomass
- Lower dissolved oxygen
Prediction:
- Fish mortality increases
- Shift toward anaerobic organisms
Forest Ecosystem Data
- Large herbivore population increases
- Tree seedling density decreases
Prediction:
- Reduced forest regeneration
- Long-term decline in forest cover
📊 Summary Table: Data → Prediction Logic
| Data Trend | Key Factor | Predicted Effect |
|---|---|---|
| Temperature ↑ | Abiotic | Species loss, shift in composition |
| Rainfall ↓ | Abiotic | Lower productivity |
| Nutrients ↑ | Abiotic | Algal blooms |
| Predators ↑ | Biotic | Herbivores ↓, plants ↑ |
| Competitor ↑ | Biotic | Other species ↓ |
📦 Quick Recap
Always identify the changing factor first
Use trends, not single data points
Abiotic data affect physiology and productivity
Biotic data affect population interactions
Predictions must follow ecological logic