EVO 1.2 Classifying Evolutionary Relationships - Pre AP Biology Study Notes - New Syllabus.
EVO 1.2 Classifying Evolutionary Relationships – Pre AP Biology Study Notes
EVO 1.2 Classifying Evolutionary Relationships – Pre AP Biology Study Notes – New Syllabus.
LEARNING OBJECTIVE
EVO 1.2(a) Create or use models to illustrate evolutionary relationships.
EVO 1.2(b) Use models of evolutionary relationships to describe and/or analyze how different species are related.
Key Concepts:
- EVO 1.2.1 Evolutionary relationships between organisms can be modeled using cladograms and phylogenetic trees, which show inferred evolutionary relationships among living things.
a. Cladograms and phylogenetic trees can illustrate speciation events.
b. These models of evolutionary relationships show tree-like lineages that do not correlate to levels of complexity or advancement.
Create or Use Models to Illustrate Evolutionary Relationships
🌱 Introduction
Evolutionary relationships cannot be observed directly.
Scientists use models to represent how species are related through common ancestry.
These models are based on evidence from:
- Fossils
- Homologies
- DNA comparisons
Models help us visualize evolutionary patterns that occurred over long periods of time.
🧬 What Is a Model in Evolution?
A model is a simplified visual representation of evolutionary relationships.
Key ideas about evolutionary models:
- Show patterns of descent from common ancestors
- Based on scientific evidence
- Inferred, not exact records
Models help explain relationships, not recreate exact evolutionary history.
🌳 Types of Evolutionary Models
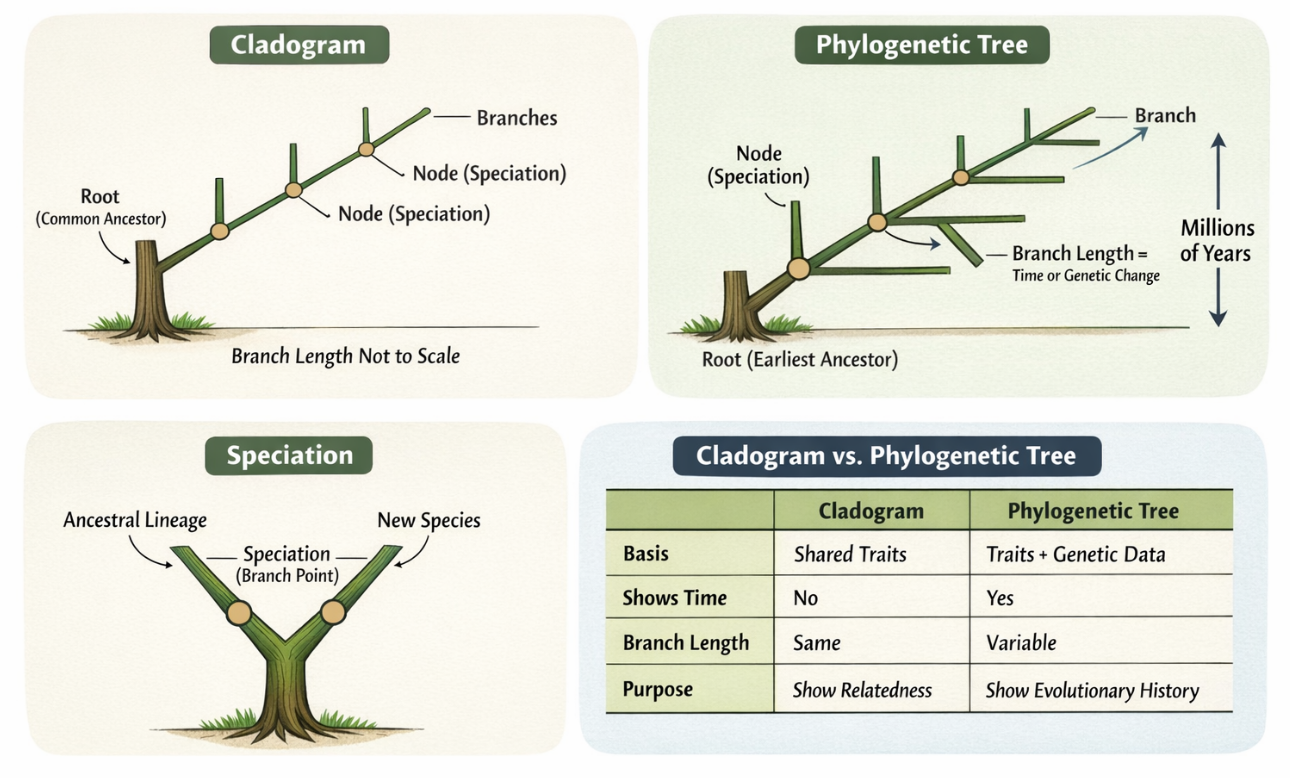
1. Cladogram
A cladogram is a branching diagram based on shared derived characteristics.
What it shows:
- Relative relatedness among organisms
- Patterns of shared ancestry
Key points:
- Root → common ancestor
- Branches → evolutionary lineages
- Node (branch point) → common ancestor + speciation event
- Branch length does not show time
- Only the branching pattern matters
Cladograms compare traits, not time.
2. Phylogenetic Tree
A phylogenetic tree is a branching diagram that may include time or genetic change.
What it shows:
- Evolutionary history of organisms
- Relationships over time
Key points:
- Root → earliest ancestor
- Branches → lineages changing over time
- Nodes → speciation events
- Branch length may represent time or amount of genetic change
Phylogenetic trees give more information than cladograms.
🌱 Speciation in Models
Speciation is the formation of a new species.
In evolutionary models:
- Speciation is shown as a branch point (node)
- One ancestral lineage splits into two
- Each branch represents an independent evolutionary path
Every node represents a common ancestor.
🚫 Important Clarification
Evolutionary models do NOT show:
- Complexity
- Advancement
- “Higher” or “lower” organisms
Key understanding:
- All living species are equally evolved
- Evolution is branching, not linear
A species at the tip of a branch is not “more evolved” than others.
📊 Cladogram vs Phylogenetic Tree
| Feature | Cladogram | Phylogenetic Tree |
|---|---|---|
| Based on | Shared traits | Traits + genetic data |
| Shows time | No | May show |
| Branch length | Same | Variable |
| Purpose | Show relatedness | Show evolutionary history |
📦 Quick Recap
✔ Models illustrate evolutionary relationships
✔ Cladograms use shared derived traits
✔ Phylogenetic trees may show time or genetic change
✔ Nodes represent common ancestors and speciation
✔ Models show relationships, not progress
✔ Closely related species share the most recent common ancestor
Using Models of Evolutionary Relationships to Describe & Analyze How Species Are Related
🌱 Introduction
Evolutionary relationships between organisms cannot be seen directly.
Scientists therefore use evolutionary models to describe and analyze how different species are related through common ancestry.
These models are built using evidence from:
- Fossils
- Homologous structures
- DNA and molecular data
The most commonly used models are:
- Cladograms
- Phylogenetic trees
🧬 Basic Components of Evolutionary Models
Understanding these terms is compulsory before analysis.
| Component | Meaning |
|---|---|
| Root | Earliest common ancestor in the model |
| Branch | Evolutionary lineage |
| Node (branch point) | Common ancestor + speciation event |
| Tips | Present-day species |
🔑 Golden Rule of Relationship Analysis
Species that share the most recent common ancestor are the most closely related.
This rule applies to all cladograms and phylogenetic trees, without exception.
🌳 Using Cladograms to Analyze Relationships
What a Cladogram Shows
- Relative evolutionary relatedness
- Order of divergence from common ancestors
- Speciation events
What a Cladogram Does NOT Show
- Time
- Complexity
- Degree of advancement
🧠 Step-by-Step Cladogram Analysis
Step 1: Identify the Species
- Species are located at the tips of branches
- Each tip represents a current species
Step 2: Trace Backward
- Trace each species back toward the root
- Look for where two branches meet
Step 3: Locate the Most Recent Common Ancestor (MRCA)
- The closest shared node between two species is their MRCA
- Species sharing the nearest node are most closely related
Step 4: Compare Multiple Species
- Fewer nodes between species → closer relationship
- More nodes between species → distant relationship
Always compare two species at a time.
📍 Important Cladogram Rules
- Left-right position does not matter
- Species next to each other are not always closest relatives
- Only the branching pattern determines relationship
🌳 Using Phylogenetic Trees to Analyze Relationships
What a Phylogenetic Tree Shows
- Evolutionary relationships
- Speciation events
- Often time or genetic change
Branch Length in Phylogenetic Trees
- Longer branch may indicate:
- More genetic change
- More time since divergence
Relatedness is still determined by common ancestry, not branch length alone.
🌱 Speciation and Relationship Interpretation
- Each node represents a speciation event
- One ancestral population splits into two
- Descendant species evolve independently
Species that diverged more recently are more closely related.
📊 Relationship Analysis Summary Table
| Model Observation | Correct Conclusion |
|---|---|
| Shared recent node | Closely related |
| Shared older node | Distantly related |
| Many nodes between species | Less related |
| Physical similarity | Unreliable |
| Branching pattern | Most reliable |
📦 Quick Recap
✔ Evolutionary models help analyze species relationships
✔ Relatedness depends on common ancestry
✔ Closest relatives share the most recent common ancestor
✔ Nodes represent speciation events
✔ Ignore appearance and position
✔ Evolution is branching, not linear
