How Selective Pressures in the Environment Affect an Organism’s Fitness
🌱 Introduction
Organisms live in environments that constantly challenge survival and reproduction.
These challenges are called selective pressures.
Selective pressures determine which individuals survive, reproduce, and pass on their genes, thereby affecting an organism’s fitness.
🧬 Key Definitions
Selective Pressure
Any environmental factor that affects an organism’s ability to:
- Survive
- Reproduce
Selective pressures can favor some traits while disadvantaging others.
Fitness
Fitness is an organism’s reproductive success.
Measured by:
- Ability to survive to reproductive age
- Number of viable offspring produced
Fitness is relative, not absolute.
An organism is fit only in a specific environment.
🌍 Types of Selective Pressures
Abiotic Selective Pressures (Non-living Factors)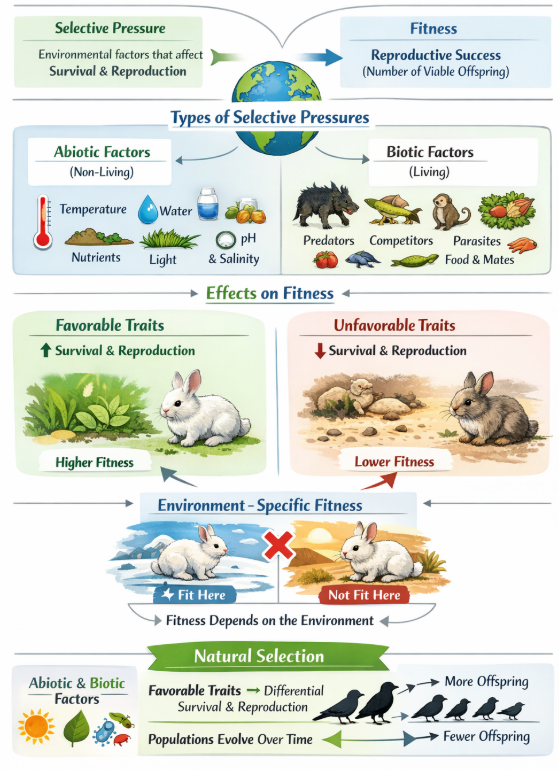
These are physical or chemical components of the environment.
Examples:
- Temperature
- Water availability
- Nutrient levels
- Light intensity
- pH
- Salinity
Abiotic pressures affect:
- Metabolism
- Growth
- Survival
Biotic Selective Pressures (Living Factors)
These involve interactions with other organisms.
Examples:
- Predators
- Competitors
- Parasites
- Pathogens
- Availability of food or mates
Biotic pressures affect:
- Survival chances
- Reproductive opportunities
🧠 How Selective Pressures Affect Fitness
Favorable Traits
Traits that improve survival or reproduction under specific conditions.
Individuals with these traits:
- Survive longer
- Reproduce more
- Pass on these traits more frequently
Result → Higher fitness
Unfavorable Traits
Traits that reduce survival or reproductive success.
Individuals with these traits:
- Die earlier
- Produce fewer offspring
- Contribute less to the next generation
Result → Lower fitness
Environment-Specific Fitness
A trait that increases fitness in one environment may reduce fitness in another.
Fitness changes if the environment changes.
There is no universally “best” trait.
🌿 Fitness and Natural Selection
- Natural selection acts on existing variation
- Selective pressures do not create new traits
- They determine which traits are favored
Individuals do not evolve.
Populations evolve over generations.
🧬 Key Concept
- Abiotic and biotic factors act as selective pressures
- Favorable traits lead to:
- Differential survival
- Differential reproduction
This difference in reproduction = fitness differences
📊 Summary Table
| Factor | Effect on Fitness |
|---|---|
| Favorable trait | Increases fitness |
| Unfavorable trait | Decreases fitness |
| Abiotic pressure | Affects survival |
| Biotic pressure | Affects survival & reproduction |
| Environmental change | Alters which traits are favored |
📦 Quick Recap
✔ Selective pressures are environmental challenges
✔ Fitness = reproductive success
✔ Abiotic and biotic factors act as selective pressures
✔ Favorable traits increase fitness
✔ Unfavorable traits reduce fitness
✔ Fitness is environment-specific
✔ Natural selection acts on variation
How Selective Pressures Cause Shifts in Phenotypic and Allele Frequencies
🌱 Introduction
Populations show variation in traits.
When the environment applies selective pressures, some traits provide an advantage while others do not.
Over generations, this leads to changes in phenotypes and allele frequencies within a population.
This process is a core mechanism of natural selection.
🧬 Key Definitions
Phenotypic Frequency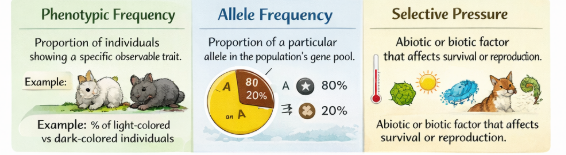
The proportion of individuals showing a specific observable trait.
Example: Percentage of light-colored vs dark-colored individuals
Allele Frequency
The proportion of a particular allele in the population’s gene pool.
Calculated across all individuals, not just those expressing the trait.
Selective Pressure
Any abiotic or biotic environmental factor that affects survival or reproduction.
Selective pressures act on phenotypes, but evolution is measured as allele frequency change.
🧠 Core Principle
Natural selection changes allele frequencies by favoring phenotypes that increase fitness in a given environment.
🌿 How Selective Pressures Cause Phenotypic Shifts
Step 1: Variation Exists
- Individuals differ in traits due to genetic variation
- Different phenotypes exist in the population
Step 2: Environment Applies Pressure
Examples:
- Predators
- Limited food
- Climate conditions
- Disease
These pressures do not act equally on all phenotypes.
Step 3: Differential Survival and Reproduction
Individuals with advantageous phenotypes:
- Survive longer
- Reproduce more
Individuals with disadvantageous phenotypes:
- Leave fewer offspring
Step 4: Phenotypic Frequency Shifts
- Favorable phenotypes become more common
- Unfavorable phenotypes become less common
This shift is observed across multiple generations, not immediately.
🧬 How Phenotypic Shifts Lead to Allele Frequency Changes
Important Link
- Phenotypes are controlled by genes
- Genes are inherited as alleles
Process of Allele Frequency Change
- Favorable phenotype → associated allele passed on more often
- Alleles linked to low fitness → passed on less often
Over time:
- Frequency of advantageous alleles increases
- Frequency of disadvantageous alleles decreases
This is evolution at the population level.
🌱 Adaptations and Allele Frequency
A heritable trait that increases fitness is an adaptation.
As selection continues:
- Alleles responsible for adaptations accumulate
- Population becomes better suited to its environment
🌿 Patterns of Natural Selection That Shift Frequencies
1. Directional Selection
- One extreme phenotype is favored
- Mean phenotype shifts in one direction
- Alleles for favored trait increase
2. Stabilizing Selection
- Intermediate phenotype favored
- Extremes selected against
- Reduces variation, maintains allele balance
3. Disruptive Selection
- Both extremes favored
- Intermediate selected against
- Can increase variation and lead to speciation
🌍 Environment-Dependent Nature of Selection
- What is favorable depends on the current environment
- Environmental change can:
- Reverse selection
- Favor previously rare alleles
- Alter phenotypic distribution
There are no permanently superior traits.
🧠 Important Clarifications
- Selection acts on phenotypes, not directly on alleles
- Individuals do not evolve
- Populations evolve through allele frequency changes
- Traits must be heritable to affect evolution
📊 Summary Table
| Process | Result |
|---|---|
| Selective pressure | Unequal survival & reproduction |
| Favorable phenotype | Increases in frequency |
| Unfavorable phenotype | Decreases in frequency |
| Advantageous allele | Becomes more common |
| Population over time | Evolves |
📦 Quick Recap
✔ Selective pressures favor certain phenotypes
✔ Phenotypes linked to higher fitness increase
✔ Alleles controlling favorable traits increase in frequency
✔ Unfavorable alleles decrease over generations
✔ Evolution = change in allele frequencies
✔ Selection acts on populations, not individuals
Using Data to Describe How Environmental Changes Affect Phenotypes in a Population
🌱 Introduction
Populations show variation in phenotypes.
When the environment changes, certain phenotypes become more favorable, while others become less favorable.
Using data such as graphs, tables, and trends, scientists can describe how phenotype frequencies change in response to environmental change.
🧬 Key Terms
Phenotype
The observable characteristics of an organism.
Includes:
- Physical traits (color, size, shape)
- Physiological traits (tolerance, resistance)

- Behavioral traits
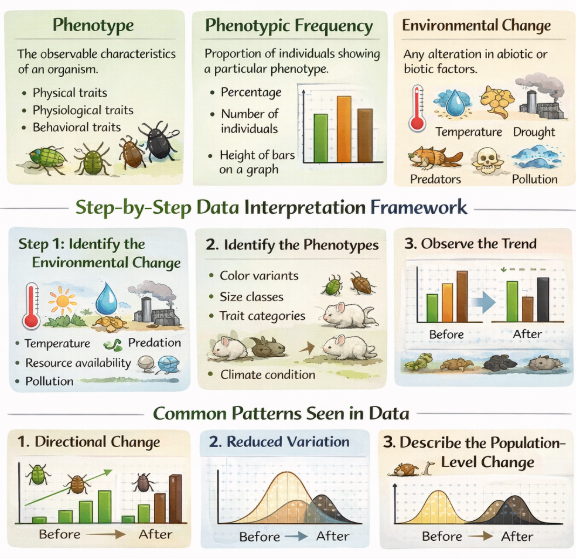
Phenotypic Frequency
The proportion of individuals in a population showing a particular phenotype.
Often expressed as:
- Percentage
- Number of individuals
- Height of bars on a graph
Environmental Change
Any alteration in abiotic or biotic factors.
Examples:
- Temperature increase or decrease
- Drought or flooding
- Introduction or removal of predators
- Disease outbreak
- Pollution or habitat modification
📊 Types of Data Used
Environmental effects on phenotypes are commonly shown using:
- Bar graphs → compare phenotype frequencies
- Line graphs → show changes over time
- Bell-shaped curves → show phenotype distribution
🧠 What “Use Data” Means
When given data, you must:
- Identify what changed in the environment
- Identify which phenotype is being measured
- Describe how phenotype frequencies changed
- Avoid explaining why unless asked
📌 Use clear descriptive terms:
- Increased / decreased
- More common / less common
- Shifted left or right
- Remained constant
🌿 Step-by-Step Data Interpretation Framework
Step 1: Identify the Environmental Change
From the question or graph, determine what factor changed.
- Temperature
- Predation
- Resource availability
- Pollution
- Climate condition
Step 2: Identify the Phenotypes
Determine which phenotypes are shown:
- Color variants
- Size classes
- Trait categories
Each bar or section represents a phenotype.
Step 3: Observe the Trend
Compare data before vs after the environmental change:
- Which phenotype increased?
- Which phenotype decreased?
- Did one phenotype become dominant?
Step 4: Describe the Population-Level Change
Describe how the overall phenotypic distribution changed.
Always describe change at the population level.
🌱 Common Patterns Seen in Data
1. Directional Change
- One phenotype increases steadily
- Opposite phenotype decreases
- Graph shows a shift in one direction
Indicates the environment favors one extreme phenotype.
2. Reduced Variation
- Intermediate phenotype becomes most common
- Extreme phenotypes decrease
- Bell curve becomes narrower
Indicates selection against extremes.
3. Increased Variation
- Both extreme phenotypes increase
- Intermediate phenotype decreases
- Distribution becomes split
Indicates environment favors multiple phenotypes.
🌍 Environmental Change and Phenotypic Advantage
- A phenotype that is common before an environmental change may decrease in frequency after change
- A previously rare phenotype may increase and become common
Favorable phenotypes depend on the environment.
🚫 Common Student Mistakes
- Explaining allele changes instead of describing phenotypes
- Talking about survival mechanisms instead of data trends
- Describing individual organisms instead of populations
- Ignoring units, axes, or labels on graphs
📊 Summary Table
| Data Observation | Correct Description |
|---|---|
| Increase in bars | Phenotype frequency increased |
| Decrease in bars | Phenotype frequency decreased |
| Curve shifts | Population phenotype changed |
| One phenotype dominates | Environmental advantage |
| Distribution changes | Population response to environment |
📦 Quick Recap
✔ Environmental changes affect phenotype frequencies
✔ Data shows population-level trends
✔ Identify environment change first
✔ Observe phenotype frequency shifts
✔ Use increase / decrease language
✔ Do not explain mechanisms unless asked
✔ Phenotypes, not individuals, are analyzed