Using Models to Analyze Probability of Trait Inheritance
🌿 Introduction
When parents reproduce, they do not “choose” which alleles they pass on.
Allele inheritance follows the rules of:
- Meiosis
- Random fertilization
- Probability
Because gamete formation and fertilization are random events, inheritance can be predicted using:
Mathematical probability
Punnett square models
These tools allow us to calculate the likelihood that offspring will inherit certain traits.
🧠Why Probability Applies to Inheritance
During meiosis:
- Each parent produces gametes
- Each gamete carries one allele for each gene
- Alleles separate randomly
Example:
If a parent has genotype Aa:
- 50% of gametes carry A
- 50% carry a
This is a probability of ½ for each allele.
When two parents reproduce, their allele combinations are random.
So, inheritance is predictable using probability rules.
🎲 Basic Rules of Probability
Two key rules are used.
Multiplication Rule (AND Rule)
Used when calculating probability of two independent events occurring together.
Example:
Parent 1 passes A (½ probability)
Parent 2 passes A (½ probability)
Probability of offspring being AA:
½ × ½ = ¼
This rule applies because each parent’s allele contribution is independent.
Addition Rule (OR Rule)
Used when calculating probability of either of two possible outcomes.
Example:
Probability of Aa = ½
Probability of AA = ¼
Probability of dominant phenotype:
½ + ¼ = ¾
So dominant phenotype probability = ¾
🧬Punnett Squares as Models
Punnett squares organize possible allele combinations.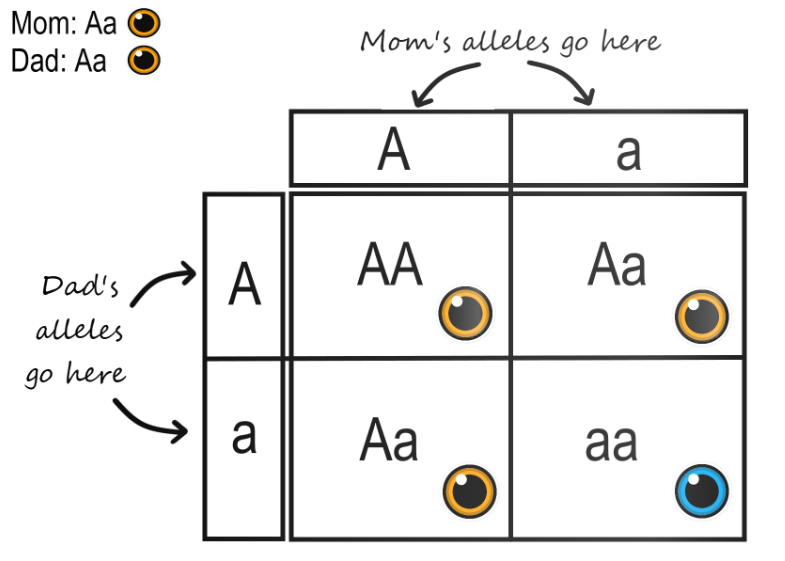
Example:
Cross Aa × Aa
Gametes:
- Parent 1: A or a
- Parent 2: A or a
Punnett square produces:
AA
Aa
Aa
aa
Genotype ratio:
1 AA : 2 Aa : 1 aa
Phenotype ratio:
3 dominant : 1 recessive
So probability of recessive phenotype:
1/4
Punnett squares visually represent probability.
🧠 Example Analysis
Example Question:
Two heterozygous parents (Aa × Aa)
What is probability of offspring being recessive (aa)?
Step 1: Identify allele probabilities
Each parent gives “a” with probability ½
Step 2: Multiply probabilities
½ × ½ = ¼
So:
25% chance of recessive phenotype.
🧬Multi-Trait Probability
If analyzing two traits at once:
Example:
AaBb × AaBb
Each trait follows independent probability.
Probability of recessive for first trait = ¼
Probability of recessive for second trait = ¼
Probability of both recessive traits:
¼ × ¼ = 1/16
Multiplication rule is applied for independent traits.
🧠 Why Models Are Important
Models allow us to:
- Predict outcomes before offspring are produced
- Estimate trait likelihood
- Understand inheritance risk
- Analyze genetic crosses
They do not guarantee exact outcomes in small families, but they predict probabilities in large populations.
📊 Summary Table
| Tool | Purpose |
|---|---|
| Punnett Square | Visualize allele combinations |
| Multiplication Rule | Calculate combined probabilities |
| Addition Rule | Calculate alternative outcomes |
| Probability Ratios | Predict phenotype likelihood |
📦 Quick Recap
Inheritance follows probability
Gamete formation is random
Multiplication rule → AND events
Addition rule → OR events
Punnett square predicts genotype ratio
3:1 → typical Mendelian phenotype ratio
Predicting Inheritance of Non-Mendelian Traits
🌿 Introduction
Mendelian inheritance works well for traits controlled by:
- One gene
- Two alleles
- One allele completely dominant
But most traits do not follow that simple pattern.
Non-Mendelian inheritance includes cases where:
- Both alleles show in the phenotype
- Heterozygotes show an intermediate phenotype
- Traits depend on sex chromosomes
- Traits involve multiple genes or environment
To predict these traits, we still use genetic models such as Punnett squares, but we change how we interpret results.
🧠 General Strategy to Predict Non-Mendelian Traits
- Identify the inheritance pattern from the description or data
- Write the allele symbols correctly
- List possible gametes
- Use a Punnett square or probability
- Convert genotypes into phenotypes using the correct rule for that pattern
🧬 Pattern 1 – Incomplete Dominance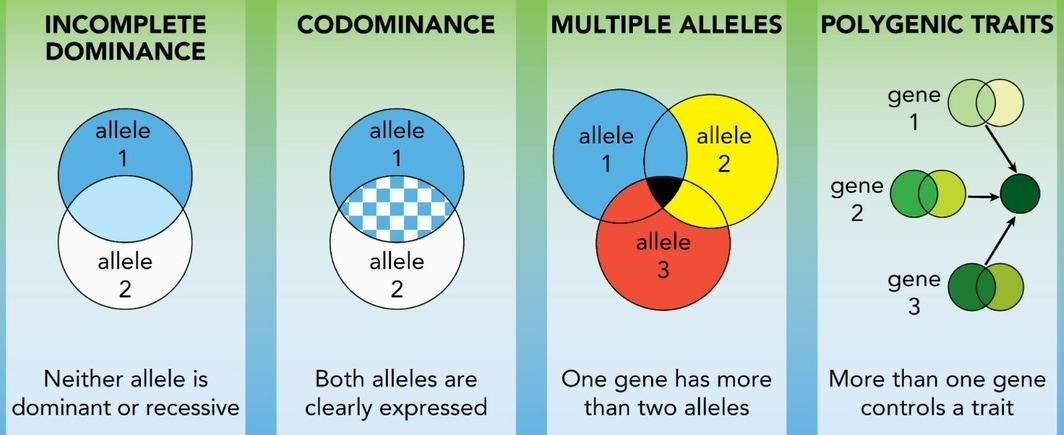
What It Means
- Neither allele is completely dominant
- Heterozygote shows an intermediate phenotype
Phenotype mapping:
RR = one extreme phenotype
Rr = intermediate phenotype
rr = other extreme phenotype
Prediction Using Punnett Square
If two heterozygotes cross:
Rr × Rr
Genotype ratio:
1 RR : 2 Rr : 1 rr
Phenotype ratio is also:
1 : 2 : 1
Each genotype has a different phenotype.
Key clue in questions:
- Intermediate
- Blended
- Mixed phenotype but not both traits separately
Example:
Red + White → Pink
🧬 Pattern 2 – Codominance
What It Means
- Both alleles are fully expressed in the heterozygote
- No blending occurs
Phenotype mapping:
AA = phenotype A
AB = phenotype A and B together
BB = phenotype B
Prediction Using Punnett Square
AB × AB
Genotype ratio:
1 AA : 2 AB : 1 BB
Phenotype ratio:
1 : 2 : 1
Same numerical ratio as incomplete dominance, but phenotype appearance differs.
Key clue in questions:
- Both expressed
- Both traits visible together
- Patches, stripes, both proteins present
Example:
Red and white both visible on same organism.
🧬 Pattern 3 – Sex-Linked Inheritance
What It Means
- Trait gene located on a sex chromosome
- Males are XY
- Females are XX
Males express whatever allele is on their single X chromosome.
Prediction Strategy:
- Write alleles on X chromosome (example: Xᴬ, Xᵃ)
- Write male as XY and female as XX
- Use Punnett square including X and Y
- Identify affected males, affected females, carriers
Key clue in questions:
- Trait appears more in males
- Trait skips generations through carrier females
- No father-to-son inheritance for X-linked traits
🧬 Pattern 4 – Polygenic Traits
What It Means
- Trait controlled by multiple genes
- Each gene contributes small effect
Results in:
- Continuous variation
- Many possible phenotypes
- No simple 3:1 or 1:2:1 ratio
Prediction becomes probability ranges, not fixed categories.
Key clue in questions:
- Gradual variation
- Bell-shaped distribution
Example:
Height, skin tone
🧬 Pattern 5 – Environmental Influence
Some traits depend on:
- Genotype
- Environment
Prediction:
Same genotype can produce different phenotypes under different conditions.
Clues:
- Temperature effect
- Nutrition effect
- Light exposure effect
📊 Summary Table for Fast Identification
| Pattern | Heterozygote Appearance | Typical Ratio (Hetero × Hetero) |
|---|---|---|
| Incomplete dominance | Intermediate | 1 : 2 : 1 |
| Codominance | Both traits visible | 1 : 2 : 1 |
| Sex-linked | Depends on sex | Often more males affected |
| Polygenic | Continuous range | No simple ratio |
| Environmental influence | Varies with conditions | Depends on environment |
📦 Quick Recap
Non-Mendelian = not simple dominant/recessive
Incomplete dominance → intermediate heterozygote
Codominance → both alleles expressed
Sex-linked → depends on XX vs XY
Polygenic → range, no fixed ratio
Environment can modify phenotype
Using a Pedigree to Predict Inheritance in a Family
🌿 Introduction
A pedigree is a family-tree style model used to track how a trait is inherited across generations.
It helps us:
- Identify whether a trait is dominant or recessive
- Predict who is likely a carrier
- Predict the chance future children will show the trait
So, pedigrees are used for prediction, not just recording.
🧠 Pedigree Symbols 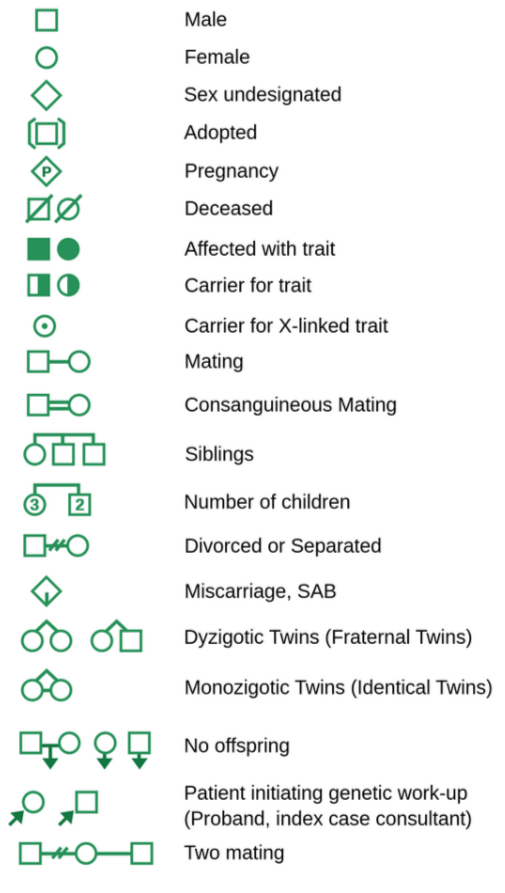
Basic symbols:
- Square = male
- Circle = female
- Shaded = has the trait (affected)
- Unshaded = does not have the trait (unaffected)
Connections:
- Horizontal line between a male and female = mating
- Vertical line down = offspring
- Siblings share the same horizontal line
These symbols help you quickly map trait inheritance.
🧬 How to Use a Pedigree to Predict Inheritance
Step 1 – Look Across Generations
Ask:
- Does the trait appear in every generation?
- Or does it skip generations?
This gives your first major clue.
Step 2 – Check Parents and Children
Key questions:
- Can two unaffected parents produce an affected child?
- Does every affected person have an affected parent?
This helps decide dominant vs recessive.
Step 3 – Compare Males vs Females
Ask:
- Are males and females affected equally?
- Is it mostly males?
This helps identify if it could be sex-linked.
Step 4 – Decide the Pattern
Based on the clues, classify as:
- Autosomal dominant
- Autosomal recessive
- Sex-linked (commonly X-linked recessive)
Then predict genotypes and probabilities.
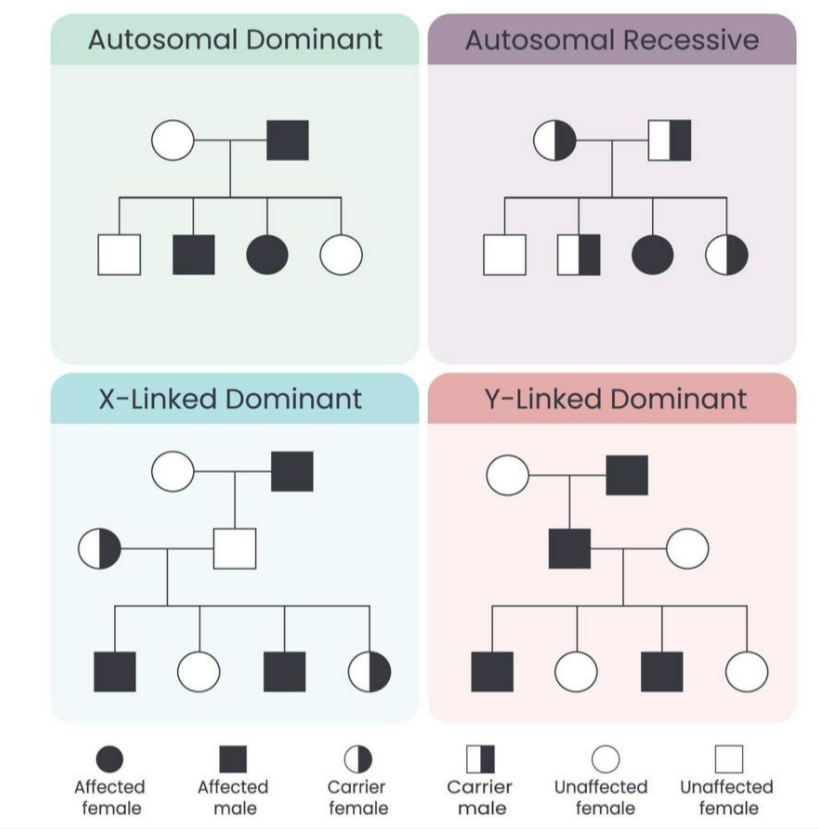
🧠 Recognizing Common Pedigree Patterns
A) Autosomal Dominant Pattern
Key pedigree clues:
- Trait appears in every generation

- Affected individuals usually have an affected parent
- Both males and females affected equally
- Unaffected parents usually do not produce affected children
Genotype idea:
- Affected individual could be Aa (most common)
- Unaffected individual is aa
Prediction use:
If affected parent is Aa and unaffected parent is aa:
Chance child affected = 1/2
B) Autosomal Recessive Pattern
Key pedigree clues:
- Trait can skip generations
- Two unaffected parents can produce an affected child
- Both sexes affected equally
Genotype idea:
- Affected individual is aa
- Unaffected individuals may be AA or Aa
- Carrier = Aa
Prediction use:
If both parents are carriers (Aa × Aa):
Chance affected child (aa) = 1/4
Chance carrier (Aa) = 1/2
Chance non-carrier (AA) = 1/4
C) Sex-Linked Pattern (X-Linked Recessive Commonly)
Key pedigree clues:
- More males affected than females
- Trait may skip generations
- Affected sons often have carrier mothers
- No father-to-son transmission
Reason:
Father gives Y to sons, not X.
Genotype idea:
- Male affected: XᵃY
- Female carrier: XᴬXᵃ
- Female affected: XᵃXᵃ (less common)
Prediction use:
Carrier mother (XᴬXᵃ) + normal father (XᴬY)
50% sons affected
50% sons normal
50% daughters carriers
50% daughters normal
🧬 Using a Pedigree to Predict Future Offspring
Once you identify the inheritance pattern:
- Assign possible genotypes to key individuals
- Identify carriers if recessive inheritance is suspected
- Use Punnett square or probability rules
- Predict likelihood in future children
This is the main skill being tested.
📊 Quick Identification Table
| Clue in Pedigree | Likely Pattern |
|---|---|
| Trait in every generation | Autosomal dominant |
| Trait skips generations | Autosomal recessive |
| Two unaffected parents produce affected child | Autosomal recessive |
| Mostly males affected | X-linked recessive likely |
| No father-to-son inheritance | X-linked |
📦 Quick Recap
Pedigree = inheritance family model
Check generations: every generation or skipping
Unaffected parents → affected child = recessive clue
Compare males vs females for sex-linkage
Assign genotypes → use probability to predict offspring