Question
Action potential is important for the movement of electrochemical impulses along a neuron. A series of action potentials along a neuron is what makes up a nerve impulse. Changes in electrical potential between the inside and outside of the cell membrane of the axon within the neuron have been recorded in the table below over (5.0) milliseconds (ms).
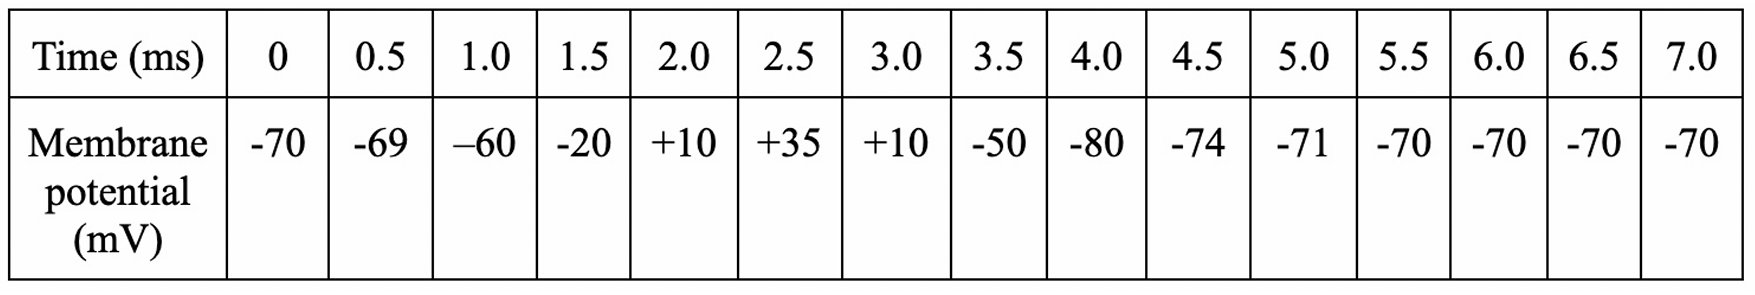
(a) Plot the data on the grid provided.

(b) Use the graph to determine the resting membrane potential.
(c) Use the graph to explain the process of transmitting electrical messages through action potentials.
Most-appropriate topic codes (Pre-AP Biology):
• TOPIC: CELLS 3.1 — Cell Membrane Structure: Maintenance of dynamic homeostasis for biological systems — part (b)
• TOPIC: CELLS 3.2 — Cell Transport: Movement of materials into or out of the cell across the cell membrane — part (c)
• Science Practice — Strategic Use of Mathematics: Use mathematics strategically to record and interpret experimental data and solve problems — part (a), (b)
• Science Practice — Attention to Modeling: Using models to explain key patterns, interactions, and relationships in biological systems — part (c)
▶️ Answer/Explanation
Detailed solution
(a)
The plot describes the curve of an action potential over time. To plot this correctly on the grid:
- X-axis (Time): Mark intervals from (0) to (7.0) ms.
- Y-axis (Membrane Potential): Mark intervals from (-80) to (+40) mV.
- Shape: The points should form a curve that starts flat at (-70) mV, curves upward sharply to a peak of (+35) mV (at (2.5) ms), falls sharply to a trough of (-80) mV (at (4.0) ms), and then curves back up to flatten out at (-70) mV.
(b)
The resting membrane potential is (-70) mV.
Explanation: This is the baseline value shown in the table at time (0) ms before the impulse begins, and the value to which the neuron returns after (5.5) ms once the action potential is complete.
(c)
The graph demonstrates the transmission of a nerve impulse through sequential changes in membrane potential:
- Depolarization ((0.5 – 2.5) ms): A stimulus triggers the opening of voltage-gated sodium channels. (\text{Na}^+) ions rush into the axon, causing the membrane potential to rise rapidly from the resting potential of (-70) mV, crossing the threshold (approx. (-60) mV at (1.0) ms) and peaking at (+35) mV. This reversal of charge transmits the electrical signal.
- Repolarization ((2.5 – 4.0) ms): At the peak ((+35) mV), sodium channels close and voltage-gated potassium channels open. (\text{K}^+) ions diffuse out of the axon, causing the potential to drop sharply back towards negative values.
- Hyperpolarization ((4.0) ms): The potential overshoots the resting level, dropping to (-80) mV. This occurs because potassium channels are slow to close, allowing excess (\text{K}^+) to leave the cell.
- Refractory Period & Restoration ((4.5 – 7.0) ms): The sodium-potassium pump actively transports (\text{Na}^+) out and (\text{K}^+) in, restoring the ion gradients and returning the membrane potential to the resting state of (-70) mV.