
▶️ Answer/Explanation
(a) Construction of the Graph
To answer this question correctly, the graph must include the following features:
1. Axes Labels: The x-axis should be labeled “Temperature (\(^\circ\text{C}\))” (Independent variable), and the y-axis should be labeled “Activity (\(\%\))” (Dependent variable).
2. Scale: An even linear scale must be used for both axes (e.g., Temperature going from \(35\) to \(40\) in increments of \(1\), and Activity from \(0\) to \(120\) in increments of \(10\) or \(20\)).
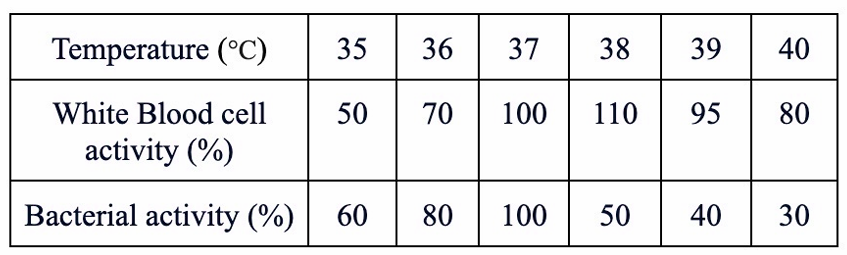
3. Plotting: Two separate sets of data points must be plotted corresponding to the values in the table.
4. Key/Legend: A clear key must be provided to distinguish between the two lines (e.g., a solid line for White Blood Cells and a dashed line for Bacteria, or different colors).
5. Curve of Best Fit: A smooth curve should be drawn connecting the points for each data set. The White Blood Cell curve should show a peak at \(38^\circ\text{C}\), while the Bacterial curve should peak at \(37^\circ\text{C}\) and drop sharply afterwards.
(b) Conclusion regarding fever as an innate response
Based on the data provided:
1. At normal body temperature (\(37^\circ\text{C}\)), bacterial activity is at its maximum (\(100\%\)), and white blood cell activity is also high (\(100\%\)).
2. However, when the temperature rises to a “fever” level of \(38^\circ\text{C}\), White Blood Cell activity increases to its peak of \(110\%\).
3. In contrast, at this same temperature (\(38^\circ\text{C}\)), Bacterial activity drops significantly to \(50\%\).
4. Conclusion: A fever (elevated temperature around \(38^\circ\text{C}\)) serves as an innate defense mechanism because it creates an environment that optimizes the activity of the immune system (White Blood Cells) while simultaneously inhibiting the growth and activity of the pathogen (bacteria).