Home / AP® Exam / Pre AP Biology / Exam Style Questions

Pre AP Biology -ECO 2.1 Population Structure- MCQ Exam Style Questions -New Syllabus 2025-2026

Pre AP Biology -ECO 2.1 Population Structure- MCQ Exam Style Questions – New Syllabus 2025-2026

Pre AP Biology -ECO 2.1 Population Structure- MCQ Exam Style Questions – Pre AP Biology – per latest Pre AP Biology Syllabus.

Pre AP Biology – MCQ Exam Style Questions- All Topics

Question

Which of these terms refers to the range of resources that a population of one species can possibly use?
a. fundamental niche
b. realized niche
c. resource partitioning
d. relative abundance
▶️ Answer/Explanation
Detailed solution

The correct answer is a. fundamental niche.

The fundamental niche represents the entire set of conditions under which a population can survive and reproduce.
It includes the full range of resources a species is theoretically capable of using in the absence of competition.
In contrast, the realized niche is the actual space and resources a species uses due to biotic constraints like predation.
Resource partitioning refers to the division of resources to avoid direct competition between species.
Relative abundance is a measure of how common or rare a species is relative to other species in a community.
Therefore, the potential range of resources is defined strictly by the fundamental niche.

Question

Half the world’s human population is at risk of being exposed to which of these diseases?
a. malaria
b. HIV
c. disease caused by Zika virus
d. disease caused by West Nile virus
▶️ Answer/Explanation
Detailed solution

The correct answer is a. malaria.
According to the World Health Organization ($WHO$), nearly $50\%$ of the global population lives in areas at risk of malaria transmission.
In $2022$, there were an estimated $249$ million cases of malaria across $85$ countries.
The disease is predominantly found in tropical and subtropical regions where Anopheles mosquitoes thrive.
While $HIV$ is a global pandemic, its prevalence does not put $50\%$ of the population at immediate risk of exposure.
Zika and West Nile viruses have significant impacts but are more geographically restricted compared to malaria.
Malaria remains one of the most widespread life-threatening parasitic diseases currently affecting humanity.

Question

Which of these terms can be used to describe the number of individuals per unit area or volume of habitat?
a. dispersion pattern
b. density
c. size
d. age structure
▶️ Answer/Explanation
Detailed solution

The correct answer is b. density.
Population density is defined as the number of individuals of a species per unit area (e.g., $100$ trees per $km^2$) or volume (e.g., $50$ plankton per $m^3$).
Dispersion refers to the spacing patterns of individuals within those boundaries.
Population size refers to the total number of individuals, $N$, in the population regardless of area.
Age structure describes the distribution of individuals in different age groups.
Therefore, the ratio of $\frac{\text{Number of Individuals}}{\text{Unit Area or Volume}}$ specifically defines density.

Question

Which of these factors refers to the number of individuals making up the population at a specified time?
a. size
b. density
c. dispersion pattern
d. age structure
▶️ Answer/Explanation
Detailed solution

The correct answer is a. size.

Population size is the total count of individuals in a population at a specific time.
Population density refers to the number of individuals per unit area or volume.
Dispersion describes the spacing $s$ and arrangement of individuals within a habitat.
Age structure represents the distribution of individuals across different age groups.
Therefore, the factor that refers purely to the total count is the population size $N$.
This value is often used to calculate growth rates over a time interval $\Delta t$.

Question

Which of these statements best describes a lichen?
a. An association between a green alga or a cyanobacterium, and one or more fungi
b. An association between a basidiomycete and an ascomycete
c. A fungus that breaks down rock to provide nutrients for an alga
d. An organism that spends half its life cycle as a photobiont and the other half as a mycobiont
▶️ Answer/Explanation
Detailed solution

The correct option is a.
A lichen is a symbiotic association between a photosynthetic partner and a fungus.
The photobiont is typically a green alga or a cyanobacterium that provides food via photosynthesis.
The mycobiont is the fungal partner (usually an Ascomycete) that provides structural support and protection.
These two organisms live together as a single functional unit, often inhabiting harsh environments.
Recent research shows some lichens actually involve one or more fungi, such as a basidiomycete yeast.
This mutualistic relationship allows them to survive where neither partner could exist alone.

Question

An experiment was conducted on the behavioral responses of a species of small freshwater fish to different temperatures. A tank with different temperatures was used, where each section (Sections A, B, C, D, and E) had different temperature ranges. Variables controlled (constants) in the experiment include the amount of available food, pH, and no other introduced organisms.

To begin the experiment, $70$ fish were placed in the tank and were allowed to swim around the sections freely. After $30$ minutes, the number of fish in each was recorded in Table 1 below.

Q. Identify the independent variable for the experiment.
A. The number of fish.
B. The number of other organisms.
C. The amount of food.
D. The Section or temperature range.
Q. Identify the dependent variable of the experiment.
A. The Section or temperature range.
B. The number of fish.
C. The number of other organisms.
D. The pH of the tank.
Q. State a variable that should be controlled in this experiment, but that was not explicitly stated to be controlled.
A. The amount of other organisms.
B. The temperature of the tank.
C. The amount of sunlight.
D. The pH of the tank.
Q. Which of the following is a correctly stated null hypothesis for the experiment?
A. If the fish are allowed to swim in all sections of the tank, then after $30$ minutes the most fish will be found in Section A.
B. If the fish are found in Section B, then they prefer temperatures of $17-22^{\circ}C$.
C. If the fish are allowed to swim in all sections of the tank, then after $30$ minutes the fish will be equally distributed in the tank across all sections.
D. The fish prefer Section C, which is temperatures of $12-17^{\circ}C$.
Q. If conducting a Chi-square test based on the null hypothesis above, which of the following correctly fills in the values for the expected number of fish in Table 1 beginning with Section A and ending with Section E?
A. $10, 20, 5, 15, 20$
B. $14, 14, 14, 14, 14$
C. $5, 10, 15, 20, 20$
D. $10, 15, 20, 15, 10$
Q. Which of the following is the correct degrees of freedom for the chi-square test in this experiment? (Hint: degrees of freedom equal $n-1$; where $n$ is the number of possible outcomes)
A. $2$
B. $3$
C. $4$
D. $5$
Q. Based on your calculated degrees of freedom from question #6, and a significance value of $p = 0.05$, determine the critical value from the Chi-Square Table.
A. $3.84$
B. $9.21$
C. $7.81$
D. $9.49$
Q. Based on the data and results of the chi-square test, which of the following can be determined?
A. The distribution of fish in the tank is random.
B. The distribution of the fish in the tank is not random.
C. The distribution of the fish in the tank is linear.
D. The distribution of the fish in the tank is equal.
▶️ Answer/Explanation
Detailed solution

A. Answer: D
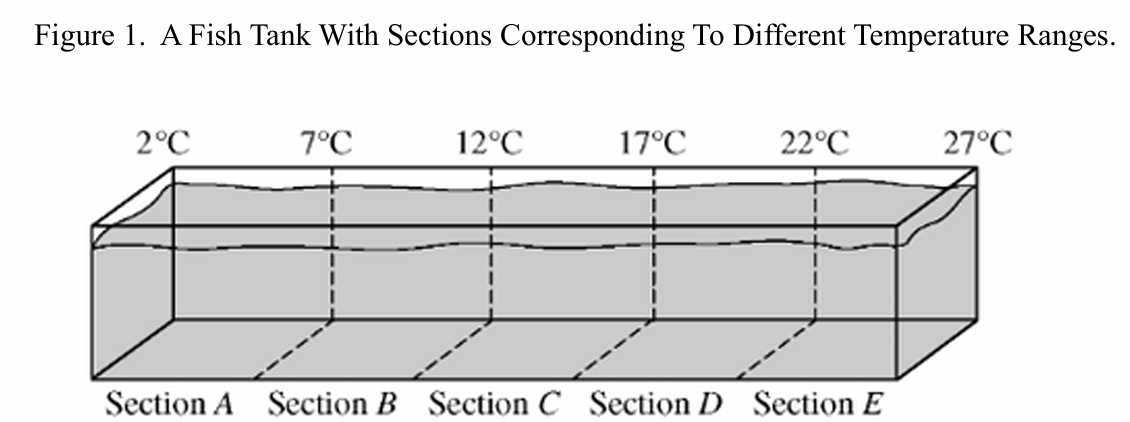
The independent variable is the variable that is changed or manipulated by the scientist.
In this experiment, the scientist manipulated the temperature ranges in each section.
Therefore, the Section or temperature range is the independent variable.

A. Answer: B
The dependent variable is the variable that is measured or observed in response to the independent variable.
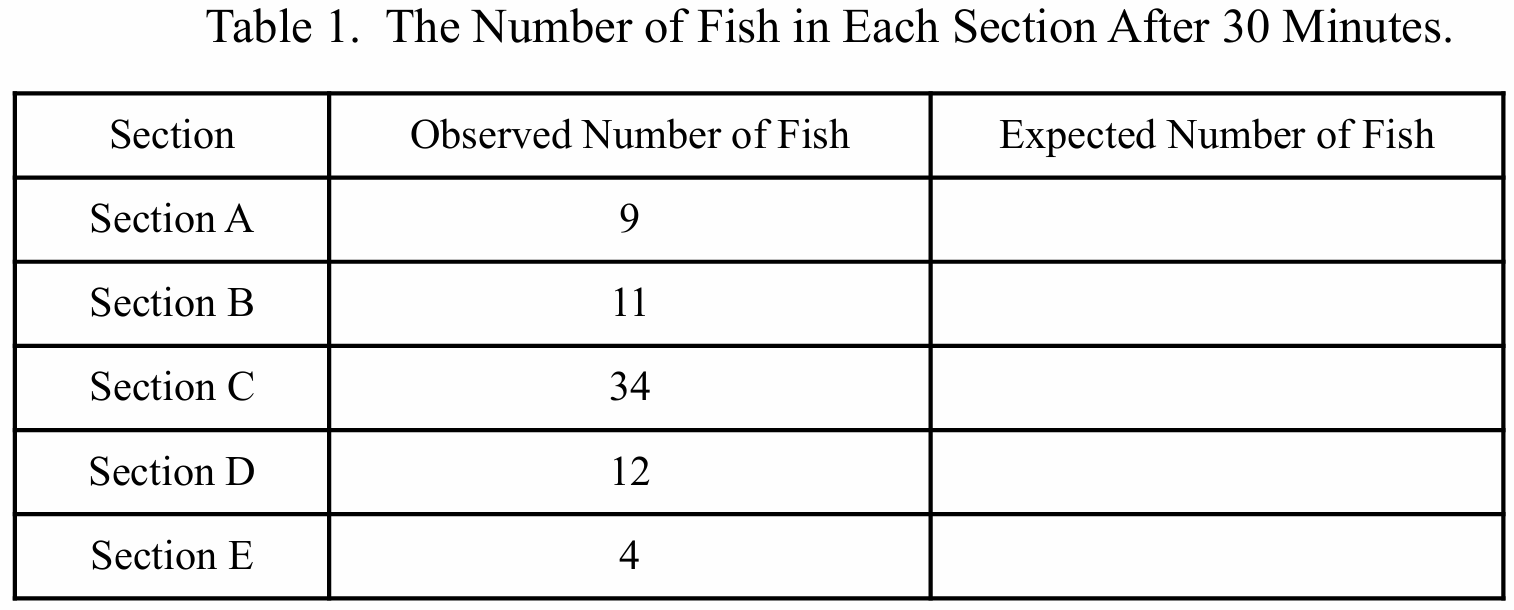
The experiment records the number of fish in each section after $30$ minutes.
Thus, the number of fish is the dependent variable.

A. Answer: C
Controlled variables are factors kept constant to prevent them from influencing the results.
Food, pH, and other organisms were explicitly mentioned as controlled.
Amount of sunlight is a crucial environmental factor for animal behavior that was not mentioned.

A. Answer: C
A null hypothesis ($H_0$) predicts no significant effect or relationship between variables.
It suggests that any observed difference is due to chance (random distribution).
Therefore, stating the fish will be equally distributed across sections is the correct null hypothesis.

A. Answer: B
The null hypothesis assumes equal distribution among the $5$ sections.
Total fish = $70$. Number of sections = $5$.
Expected value ($E$) = $\frac{\text{Total Fish}}{\text{Number of Sections}} = \frac{70}{5} = 14$.
So, the expected number is $14$ for all sections.

A. Answer: C
Degrees of freedom ($df$) is calculated as $n – 1$, where $n$ is the number of categories.
There are $5$ sections (A, B, C, D, E), so $n = 5$.
$df = 5 – 1 = 4$.

A. Answer: D
Using a standard Chi-Square Distribution Table.
Locate the row for degrees of freedom ($df$) = $4$.
Locate the column for the significance level ($p$) = $0.05$.
The critical value at this intersection is $9.49$.

A. Answer: B
To determine the result, compare the Chi-square value ($\chi^2$) to the critical value.
$\chi^2 = \sum \frac{(O-E)^2}{E}$. Section C alone contributes $\frac{(34-14)^2}{14} \approx 28.6$.
Since $28.6 > 9.49$ (critical value), we reject the null hypothesis.
This means the distribution is not random (statistically significant preference exists).

Question

Which factor would have the greatest effect on the flow of energy into an ecosystem?
A. a large decrease in the amount of sunlight available
B. a large increase in the number of carnivores
C. a small increase in the number of decomposers
D. a small decrease in the amount of minerals available
▶️ Answer/Explanation
Detailed solution

The correct answer is A.
Sunlight is the primary source of energy for nearly all ecosystems on Earth.
Producers, such as plants and algae, capture solar energy through the process of photosynthesis.
A large decrease in sunlight directly reduces the rate of energy capture at the base of the food chain.
Since energy flows from producers to consumers, a reduction at the entry point impacts the entire system.
Changes in carnivores or decomposers affect energy transfer or cycling, but not the initial input.
Therefore, sunlight availability has the most significant bottleneck effect on total energy flow.

Question

\(Q\). The graph above indicates the size of a fish population over a period of time. The section of the graph labeled \(A\) represents
A. biodiversity within the species
B. a population becoming extinct
C. nutritional relationships of the species
D. a population at equilibrium
\(Q\). The dashed line on the graph represents the
A. life span of the species
B. level at which extinction is reached
C. carrying capacity, or maximum population size for the environment
D. level of maximum biodiversity of the species
▶️ Answer/Explanation
Detailed solution
\(A\): (D)
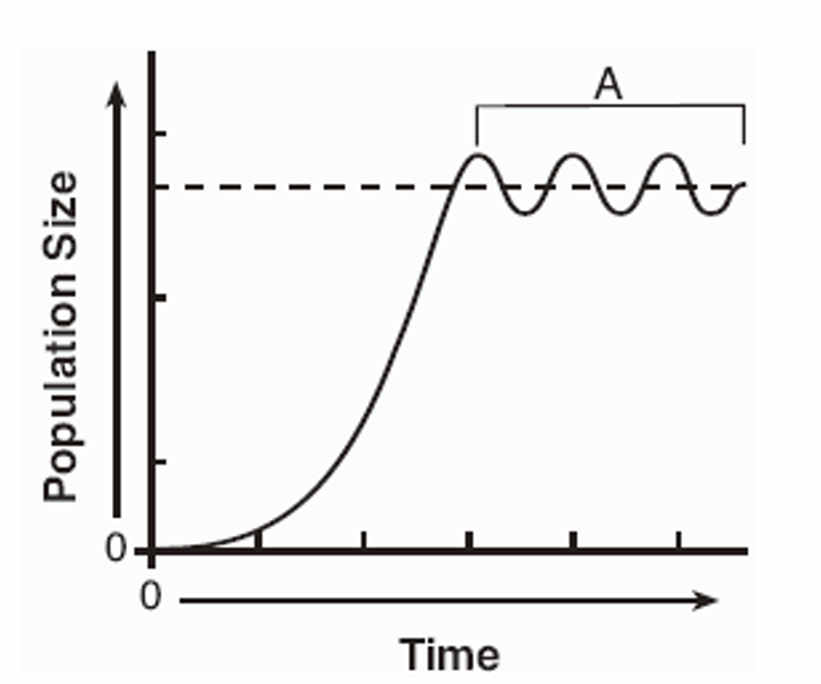
• The graph shows a logistic growth curve where the population size increases and then levels off.
• Section \(A\) depicts the population size fluctuating slightly around a constant level.
• This indicates that the birth rate and death rate are roughly equal, resulting in stability.
• Therefore, this section represents a population at equilibrium.
\(A\): (C)
• The dashed horizontal line represents the maximum limit for population growth.
• It marks the maximum number of individuals that the available resources can support.
• In ecology, this limit is defined as the carrying capacity ($K$).
• Therefore, the dashed line corresponds to the carrying capacity of the environment.

Question

Based on the data in Table 1 above, what are the correct median values for Class 1 and Class 2?
A. Class 1 has a median score of $70.2\%$, whereas Class 2 has a median score of $91.6\%$.
B. Class 1 has a median score of $81.4\%$, whereas Class 2 has a median score of $75.4\%$.
C. Class 1 has a median score of $82.0\%$, whereas Class 2 has a median score of $81.5\%$.
D. Class 1 has a median score of $75.5\%$, whereas Class 2 has a median score of $52.0\%$.
▶️ Answer/Explanation
Detailed solution

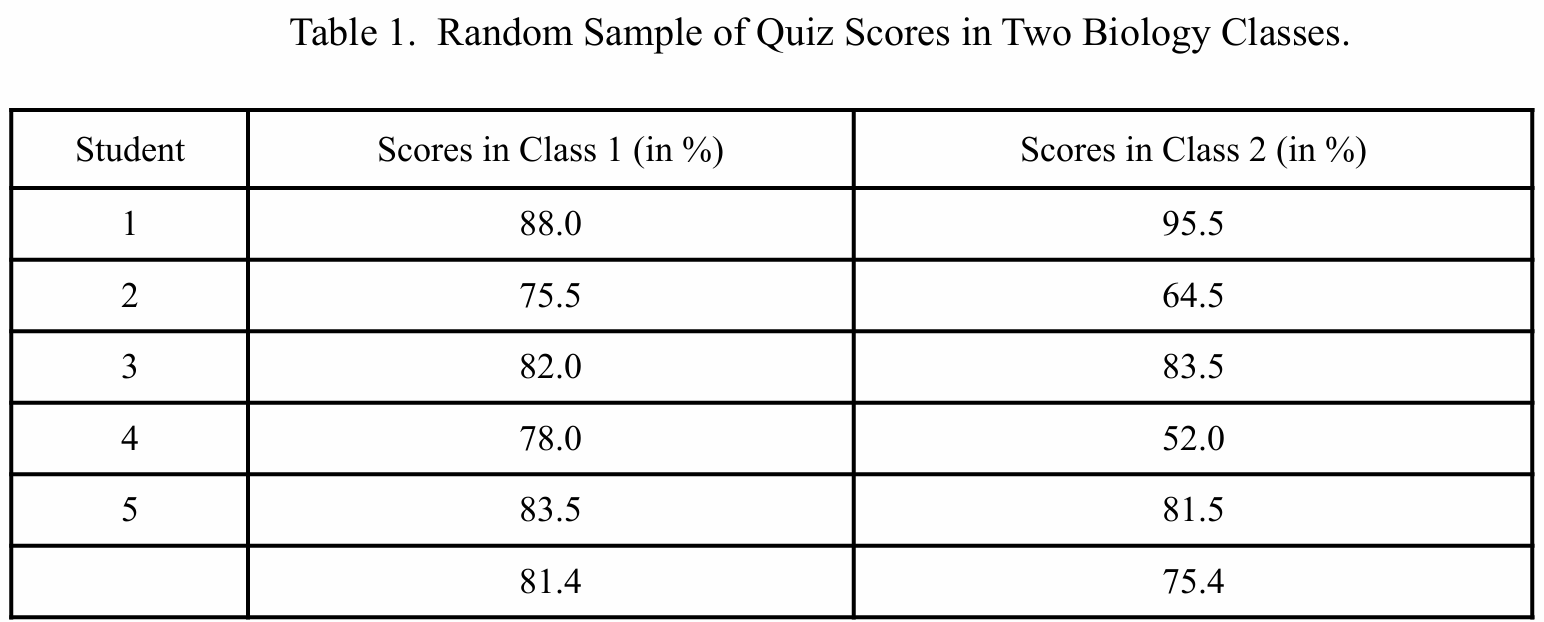
To find the median, arrange the scores from least to greatest and select the middle value.
Class 1: $75.5, 78.0, 82.0, 83.5, 88.0$. The middle value is $82.0\%$.
Class 2: $52.0, 64.5, 81.5, 83.5, 95.5$. The middle value is $81.5\%$.
Note: The values $81.4\%$ and $75.4\%$ shown in the table are the mean scores, not medians.
Option C matches the calculated median values for both classes.
Therefore, the correct answer is C.

Scroll to Top