Home / AP® Exam / Pre AP Biology / Exam Style Questions

Pre AP Biology -ECO 2.2 Population Growth- MCQ Exam Style Questions -New Syllabus 2025-2026

Pre AP Biology -ECO 2.2 Population Growth- MCQ Exam Style Questions – New Syllabus 2025-2026

Pre AP Biology -ECO 2.2 Population Growth- MCQ Exam Style Questions – Pre AP Biology – per latest Pre AP Biology Syllabus.

Pre AP Biology – MCQ Exam Style Questions- All Topics

Question

Which one of these statements is most likely a reason that human populations have sidestepped factors that usually control population growth?
a. Agriculture and industrialization have increased the carrying capacity for our species.
b. The population growth rate ($r$) for the human population has always been small.
c. The age structure of human populations has no impact on its population growth.
d. Plagues have killed off large numbers of humans at certain times in the past.
▶️ Answer/Explanation
Detailed solution

The correct answer is a.
In ecology, the carrying capacity ($K$) is the maximum population size an environment can sustain.
Humanity has used technology to artificially expand this limit.
Agriculture provided a stable food supply, allowing for higher density living.
Industrialization improved medicine, sanitation, and resource distribution.
These advancements reduced density-dependent deaths that normally limit growth.
Consequently, the human population has maintained exponential growth for an extended period.

Question

Which of these examples might reflect density-dependent regulation of population size?
a. An exterminator uses a pesticide to eliminate carpenter ants from a home.
b. Mosquitoes disappear from an area after the first frost.
c. Northeast storms blow over and kill all willow trees along a lake.
d. A clam population declines in numbers in a bay as the number of predatory herring gulls increases.
▶️ Answer/Explanation
Correct Option: d
Detailed solution

Density-dependent factors are those whose effects on the size or growth of the population vary with the population density.
Predation is a classic density-dependent factor because as a prey population grows, it attracts more predators.
In option d, the clam population decline is tied to the biological interaction with predatory gulls.
Options a, b, and c represent density-independent factors like weather or human intervention.
These abiotic factors kill individuals regardless of how many are present in the $1$ given area.
Therefore, only the predator-prey relationship reflects density-dependent regulation.

Question

Suppose that you observe an animal that gives birth to many young, but does not care for them. Which survivorship curve is it most likely that this animal represents?
a. type $I$ or type $II$
b. type $II$ or type $III$
c. type $I$
d. type $III$
▶️ Answer/Explanation
Detailed solution

The correct answer is d. type $III$.
Type $III$ curves characterize organisms that produce a large number of offspring.
These species typically provide little to no parental care for their young.
As a result, there is a very high mortality rate early in life.
The few individuals that survive the early stages tend to live for a long time.
Common examples include many fish species, marine invertebrates, and plants.

Question

Which of these patterns is a $K$-selected species likely to exhibit?
a. a type I survivorship curve and a short generation time
b. a type II survivorship curve and a short generation time
c. a type III survivorship curve and a short generation time
d. a type I survivorship curve and a long generation time
▶️ Answer/Explanation
Detailed solution

The correct option is d.
$K$-selected species live in stable environments near carrying capacity ($K$).
They typically exhibit a type I survivorship curve, meaning high survival rates in early life.
These species invest heavily in fewer offspring, leading to long generation times.
In contrast, $r$-selected species favor rapid reproduction and type III curves.
Examples of $K$-selected organisms include humans, elephants, and whales.
Therefore, the combination of high late-life survival and slow development defines this pattern.

Question

According to the logistic model of population growth, which of the following happens to the absolute number of individuals by which a population grows during a given time period?
a. It gets steadily larger as the population size increases.
b. It gets steadily smaller as the population size increases.
c. It remains constant as the population size increases.
d. It is highest when the population is at an intermediate size.
▶️ Answer/Explanation
Detailed solution

The correct option is d.
The logistic growth rate is defined by the equation $\frac{dN}{dt} = rN\left(1 – \frac{N}{K}\right)$.
At low population sizes ($N$), the growth rate is small because there are few individuals to reproduce.
As the population approaches the carrying capacity ($K$), the term $\left(1 – \frac{N}{K}\right)$ approaches $0$, slowing growth.
The maximum absolute growth rate occurs at the inflection point of the S-curve.
This point is reached when the population size is exactly half of the carrying capacity, $N = \frac{K}{2}$.
Therefore, the number of individuals added is highest at this intermediate size.

Question

Which of the following is paired according to what it stands for?
a. $K$ and population size
b. $K$ and carrying capacity
c. $r$ and carrying capacity
d. $r$ and population size
▶️ Answer/Explanation
Detailed solution

The correct option is b.
In population ecology, the variable $K$ represents the carrying capacity.
Carrying capacity is the maximum population size an environment can sustain.
The variable $r$ represents the intrinsic rate of increase or growth rate.
The variable $N$ is typically used to represent the actual population size.
Therefore, the pair “$K$ and carrying capacity” is the only accurate match.

Question

Which of these statements is most likely the advantage of taller plants over shorter plants?
a. They can capture more $\text{CO}_2$.
b. They can fertilize better.
c. They can capture sunlight better.
d. They can release seeds better.
▶️ Answer/Explanation
Detailed solution

The correct answer is c. They can capture sunlight better.
In a crowded ecosystem, plants compete intensely for light resources.
Taller plants can extend their leaves above the canopy of shorter neighbors.
This prevents them from being shaded out by surrounding vegetation.
By capturing more direct photons, they increase their rate of photosynthesis.
While height can aid seed dispersal, the primary evolutionary driver for vertical growth is light access.
$\text{CO}_2$ levels are generally uniform in the air, so height offers no specific advantage for gas capture.

Question

Which of these lists shows the order of steps by which prokaryotic cells form a biofilm?
a. Cells grow and divide; the cells’ physiology changes; cells attach to a surface that is covered in organic polymers; and cells secrete extracellular polymers that “glue” the cells to the surface and to each other.
b. The cells’ physiology changes; cells grow and divide; cells secrete extracellular polymers that “glue” the cells to the surface and to each other; and cells attach to a surface that is covered in organic polymers.
c. Cells secrete extracellular polymers that “glue” the cells to the surface and to each other; cells attach to a surface that is covered in organic polymers; cells grow and divide; and the cells’ physiology changes.
d. Cells attach to a surface that is covered in organic polymers; cells grow and divide; the cells’ physiology changes; and cells secrete extracellular polymers that “glue” the cells to the surface and to each other.
▶️ Answer/Explanation
Detailed solution

[Image of stages of biofilm formation]
The correct sequence begins with the initial attachment of cells to a conditioned surface.
Following attachment, the colonizing cells undergo growth and division to form microcolonies.
As the population density increases, cell physiology changes, often through quorum sensing.
Finally, cells secrete extracellular polymers (EPS) that provide structural integrity and adhesion.
Therefore, the correct chronological order of these biological events is represented by option d.

Question

The reason that populations of organisms do not continue to grow exponentially towards unlimited size is that:
A. there isn’t always a carrying capacity for all species.
B. resources are never infinite for a long period of time, so limiting factors such as space and food set it.
C. species rarely compete with one another because most have their own specific roles that never overlap.
D. interactions between organisms are unchanging, so growth is linear.
▶️ Answer/Explanation
Detailed solution

The correct answer is B.
Exponential growth occurs only when resources are unlimited.
In nature, resources like food, water, and space are finite.
As a population grows, limiting factors increase environmental resistance.
This defines the carrying capacity ($K$) of the environment.
Growth eventually levels off, following the logistic growth model.
Therefore, populations cannot sustain infinite expansion over time.
The mathematical expression for this limit is $\frac{dN}{dt} = rN\left(\frac{K-N}{K}\right)$.

Question

According to Figure 1 above, what is the life expectancy of all races and origins in both sexes?
A. $78.7$
B. $81.4$
C. $81.1$
D. $81.3$
▶️ Answer/Explanation
Detailed solution

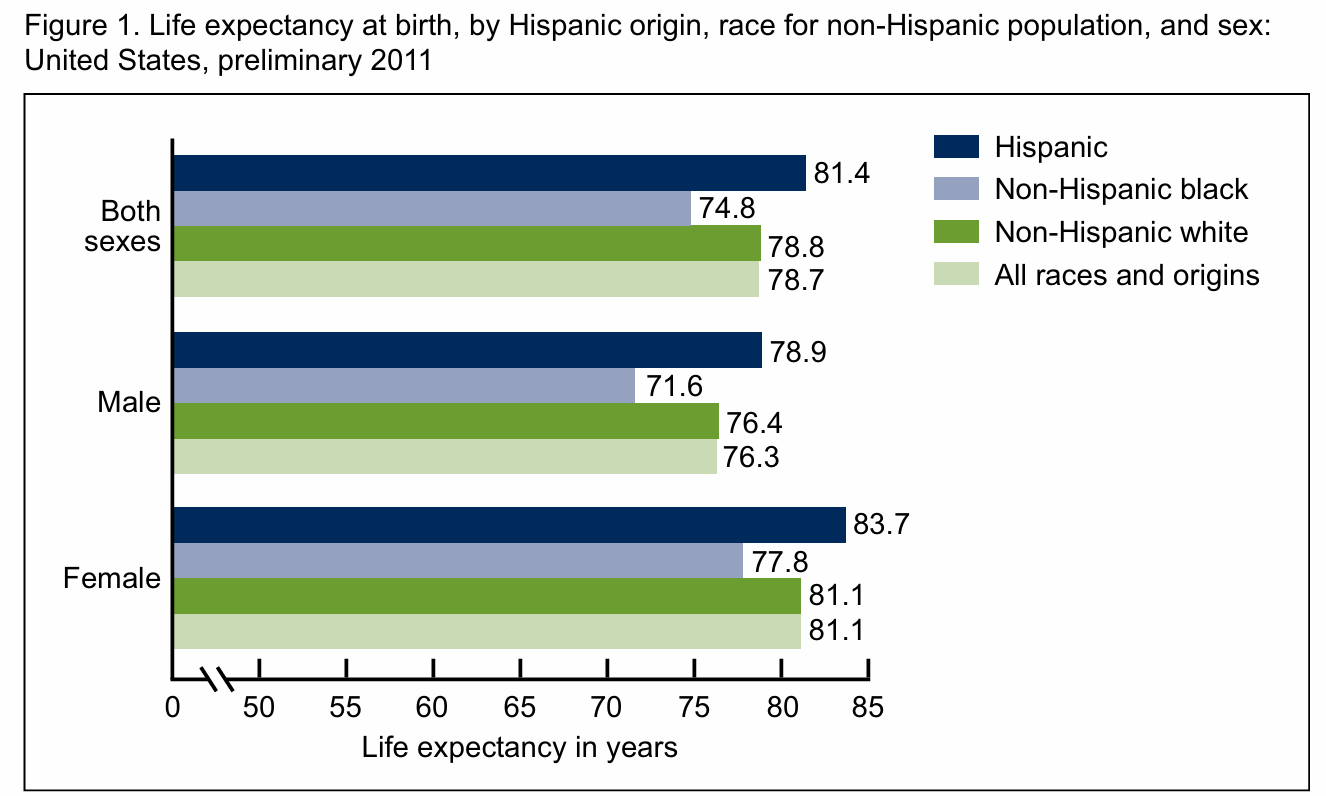
Locate the y-axis category labeled “Both sexes” at the top of the chart.
Identify the bar corresponding to “All races and origins” using the legend (light green color).
Follow the light green bar in the “Both sexes” section to its end point.
The numerical value labeled at the end of this specific bar is $78.7$.
Therefore, the life expectancy for this group is $78.7$ years.
This matches option A.

Question

According to Figure $1$ above, what is the independent variable in the figure?
A. The sex of individuals (male, female, or both sexes).
B. The race and sex of individuals.
C. The time in years.
D. The life expectancy in years.
▶️ Answer/Explanation
Detailed solution

The independent variables are the factors controlled or categorized to observe an effect.
In this chart, the data is categorized by sex (Male, Female, Both sexes).
The data is further categorized by race/ethnicity (Hispanic, Non-Hispanic black, etc.).
The dependent variable is the life expectancy, measured in $years$, on the $x$-axis.
Because both sex and race are used to group the data, they represent the independent variables.
Therefore, the correct choice is B.

Question

Which of the following would be an acceptable hypothesis for a controlled experiment that would test whether one food is better than another at speeding an animal’s growth?
A. If a group of animals was given either Food $A$ or Food $B$ to eat, then Food $A$ would cause the animals to gain more mass.
B. If a group of animals was given both Food $A$ and Food $B$ to eat, then all animals would gain more mass.
C. If a group of animals eats Food $A$, then it will stop growing and instead eat Food $B$.
D. Animals will gain mass, which causes them to each more of Food $A$.
▶️ Answer/Explanation
Correct Option: A
Detailed solution

A valid hypothesis must be a testable statement predicting the relationship between variables.
Option A uses the “$If… then…$” format to link the independent variable (type of food) to the dependent variable (mass gain).
It allows for a controlled comparison by separating the subjects into groups receiving different treatments.
Option B fails as a test of “which is better” because it provides both foods to the same group.
Option C describes animal behavior rather than a prediction of growth efficiency.
Option D incorrectly reverses the cause-and-effect relationship between growth and food consumption.
Therefore, A is the only acceptable hypothesis for testing the specific research question.

Question

A diet pill is any pharmaceutical drug that has the effect of suppressing appetite, speeding up a patient’s metabolism, or affecting a person’s absorption of calories. They are generally used by obese (overweight) patients in an attempt to lose weight. A student, Chris, wanted to test the effect of diet pills on plant growth. Specifically, he wanted to see how tall the tomato plants in his garden would grow if he gave them diet pills.

He took two pots, filled them with dirt from the same bag, and planted four tomato plants in each. He watered one planter with tap water, and he watered the other planter with tap water mixed with dissolved diet pills. The plants were in the same location to ensure they got the same amount of sunlight, and the water was measured so that each pot received the same amount of water. Chris then measured the height of each plant at the end of each week for eight weeks, and averaged the height of the four plants in each pot. He recorded the height growth to see how the diet pills affected the growth of the plants.

Q. What experimental question is Chris trying to answer?

A. Do tomatoes need water to grow?
B. Do tomatoes need sunlight to grow?
C. Do diet pills effect tomato plant growth?
D. Do tomato plants have different height based on the amount of tap water provided to them?

Q. What is the independent variable of Chris’s experiment?

A. The amount of water provided to the tomato plants.
B. The height of the tomatoes plants.
C. The location of the dirt put in the pots.
D. The presence or absence of dissolved diet pills.

Q. What is the dependent variable of this experiment?

A. The amount of water provided to the tomato plants.
B. The height of the tomatoes plants.
C. The location of the dirt put in the pots.
D. The presence or absence of dissolved diet pills.

Q. Which of the following is NOT a constant (controlled variable) in this experiment.

A. The amount of water given to each tomato plant.
B. The location and the amount of sunlight provided to each tomato plant.
C. The type of dirt put in the pots.
D. The amount of dissolved diet pills.

Q. What is the control group/treatment?

A. The tomato plant given only tap water (no dissolved diet pills).
B. The tomato plant given the most diet pills dissolved in tap water.
C. The tomato plant given the least amount of diet pills dissolved in tap water.
D. The tomato plant that forgot his homework at home, so he ate some diet pills and quickly did his homework again.

Q. Which of the following is a correctly written hypothesis for this experiment in the If/Then style of format.

A. When plants are given more sunlight, then the plants given less sunlight will grow taller.
B. If plants are given varying amounts of tap water, then the plants given more tape water will grow taller.
C. If plants are given either diet pills dissolved in tap water or just water, then the plants given only water will grow taller.
D. If plants are given either sunlight or diet pills, only the plants given sunlight will grow.

Q. Based on the data provided, which of the following correctly describes the conclusion of Chris’s experiment?

A. The tomato plants given only tap water had a statistically higher mean plant height than those given diet pills and water.
B. There was no statistically significant difference in the mean tomato plant height growth of plants given diet pills and water versus plants given only tap water.
C. The null hypothesis is reject.
D. The alternative hypothesis is supported.
▶️ Answer/Explanation
Detailed solution

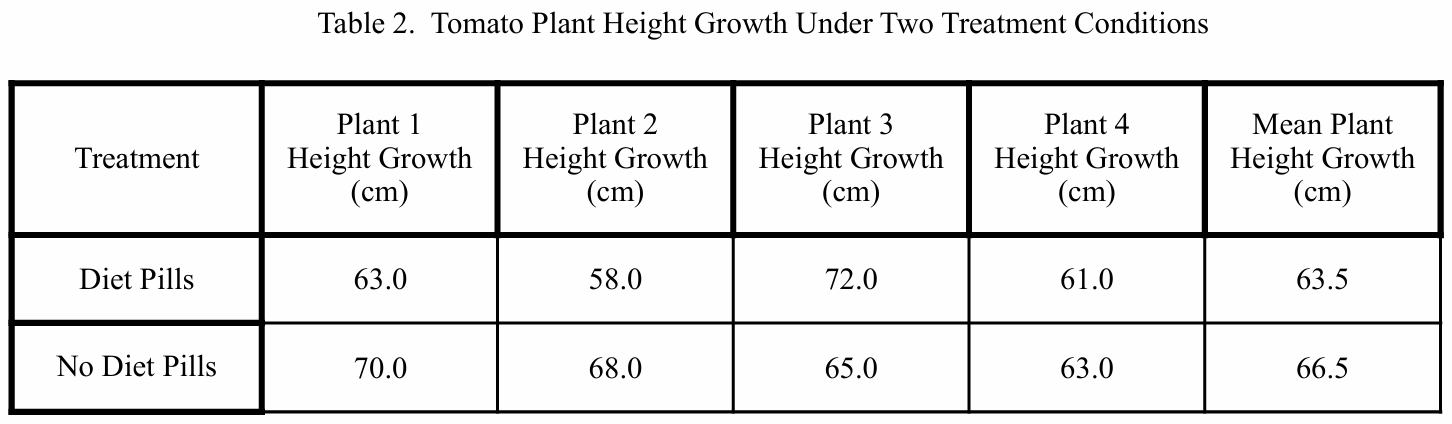
A. (C) Do diet pills effect tomato plant growth?
A. (D) The presence or absence of dissolved diet pills.
A. (B) The height of the tomatoes plants.
A. (D) The amount of dissolved diet pills.
A. (A) The tomato plant given only tap water (no dissolved diet pills).
A. (C) If plants are given either diet pills dissolved in tap water or just water, then the plants given only water will grow taller.
A. (B) There was no statistically significant difference in the mean tomato plant height growth of plants given diet pills and water versus plants given only tap water.

Explanation:
(A) The experimental question reflects the purpose of the study, which is explicitly stated as testing the effect of diet pills on plant growth.
(A) The independent variable is the one factor changed by the experimenter. Here, it is the treatment type (diet pills vs. no diet pills).
(A) The dependent variable is the data measured in response to the changes. Chris measures the height of the plants.
(A) Constants are factors kept identical across groups. Water, sunlight, and dirt are constants; the diet pill presence varies.
(A) The control group serves as a baseline and receives no experimental treatment. The plants with only tap water fit this description.
(A) A hypothesis predicts a relationship between the independent and dependent variables. Option C correctly links the pill treatment to expected growth height.
(A) While the mean for “No Diet Pills” (\(66.5\)) is slightly higher than “Diet Pills” (\(63.5\)), the individual data ranges overlap significantly (Pills: \(58\)-\(72\); No Pills: \(63\)-\(70\)). This large overlap and small sample size suggest the difference is not statistically significant.

Question

Based on the data in Table 1 above, what are the correct mean values for each class?
A. Class 1 has a mean score of $70.2\%$, whereas Class 2 has a mean score of $91.6\%$.
B. Class 1 has a mean score of $81.4\%$, whereas Class 2 has a mean score of $75.4\%$.
C. Class 1 has a mean score of $82\%$, whereas Class 2 has a mean score of $81.5\%$.
D. Class 1 has a mean score of $75.5\%$, whereas Class 2 has a mean score of $52.0\%$.
▶️ Answer/Explanation
Detailed solution

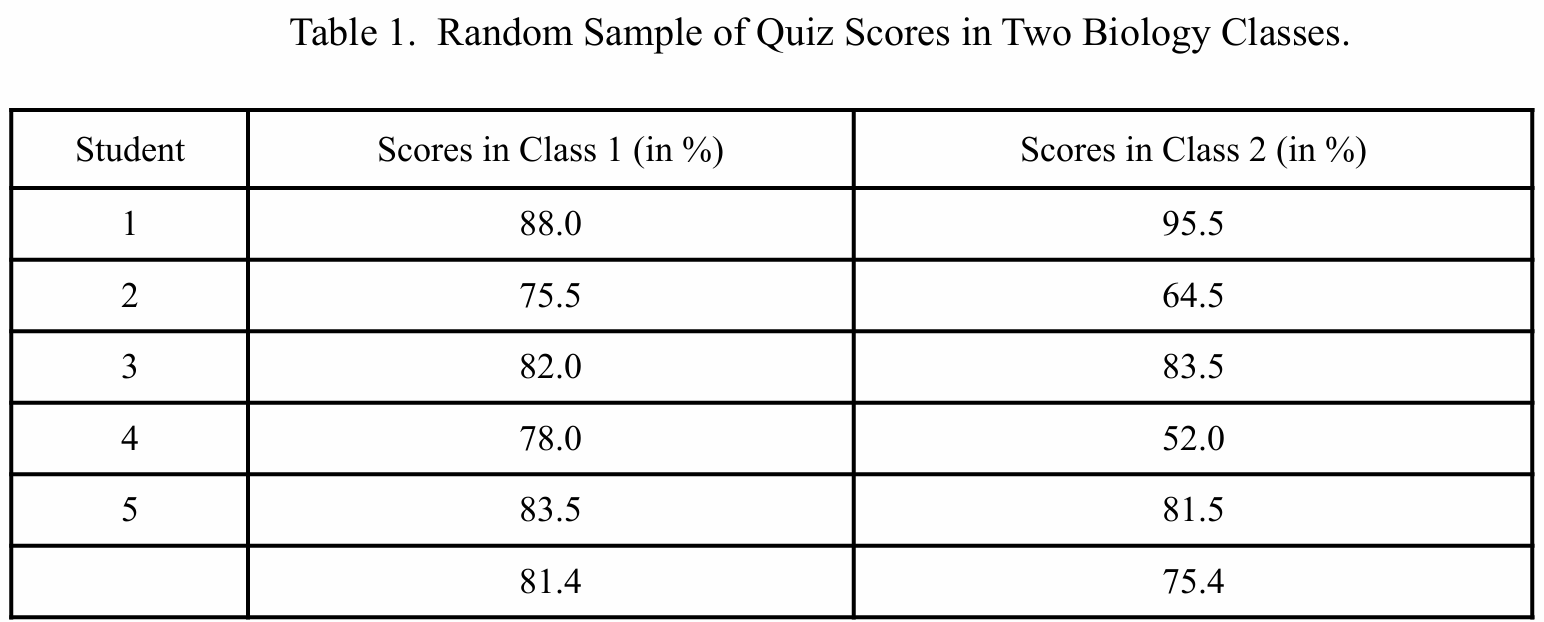
The mean is calculated by dividing the sum of all scores by the number of students ($n = 5$).
For Class 1: $\frac{88.0 + 75.5 + 82.0 + 78.0 + 83.5}{5} = \frac{407.0}{5} = 81.4\%$.
For Class 2: $\frac{95.5 + 64.5 + 83.5 + 52.0 + 81.5}{5} = \frac{377.0}{5} = 75.4\%$.
The bottom row of the provided table already displays these calculated averages.
Comparing these results to the options, Choice B matches both calculated values.
Therefore, the correct mean for Class 1 is $81.4\%$ and for Class 2 is $75.4\%$.

Question

What is the leading cause of death among individuals ages $45-64$?
A. The leading cause of death among individuals ages $45-64$ is accidents.
B. The leading cause of death among individuals ages $45-64$ is cancer.
C. The leading cause of death among individuals ages $45-64$ is all other causes.
D. The leading cause of death among individuals ages $45-64$ is tied between cancer and all other causes.
▶️ Answer/Explanation
Detailed solution

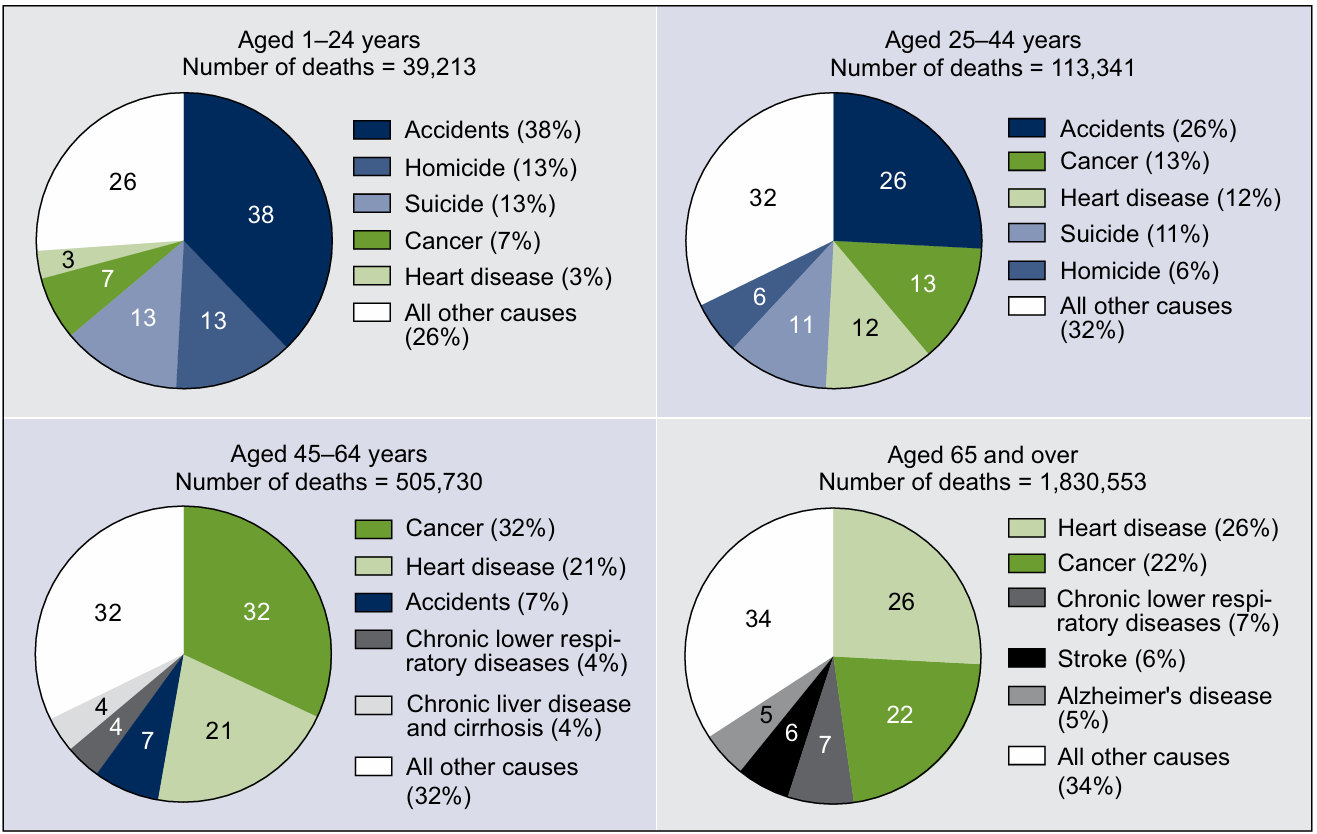
Locate the pie chart labeled Aged $45-64$ years in the provided image.
Identify the largest specific segment listed in the legend for this age group.
The chart shows Cancer accounts for $32\%$ of deaths.
The category All other causes also accounts for $32\%$ of deaths.
Since both categories share the highest percentage, there is a statistical tie.
Therefore, the correct option is D.

Question

Which of the following statements about a controlled experiment is true?
A. All the variables must be kept the same.
B. Only one variable is tested at a time.
C. All the possible hypotheses can be tested by setting up a controlled experiment.
D. Controlled experiments cannot be performed on living things.
▶️ Answer/Explanation
Detailed solution

The correct answer is B.
In a controlled experiment, scientists change exactly $1$ independent variable.
All other factors, known as constants, are kept the same to ensure a fair test.
This allows the researcher to attribute any observed changes to that single variable.
Statement A is false because the tested variable must change.
Statement C is false because some hypotheses are not testable via experimentation.
Statement D is false as controlled experiments are a staple of biological research.

Question

Cows huddle together in an attempt to avoid being bitten by flies.
What kind of adaptation is this?
(A) Structural
(B) Physiological
(C) Preventative
(D) Behavioural
▶️ Answer/Explanation
Detailed solution

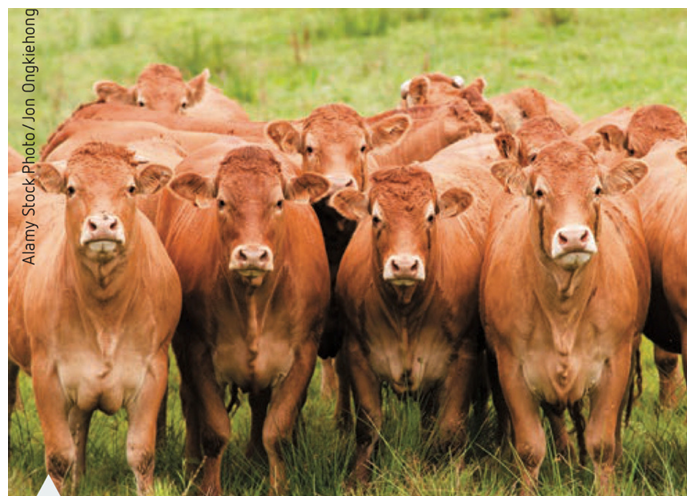
The correct option is (D) Behavioural.

Adaptations are specific traits that increase an organism’s chance of survival.

Huddling is an active response or conduct performed by the animal.

It is not a physical body part (Structural) or an internal chemical process (Physiological).

By grouping, cows reduce the individual surface area exposed to pests.

This social interaction is a textbook example of a behavioural adaptation.

This behavior is often learned or instinctive to mitigate environmental stress.

Scroll to Top