1.2.D.1 — Heating and Cooling Curves and Phase Diagrams of Pure Substances
Heating curves, cooling curves, and phase diagrams are graphical models used to show how a pure substance responds to changes in thermal energy. These models illustrate temperature changes, phase changes, and the conditions under which different states of matter exist.
Heating and Cooling Curves
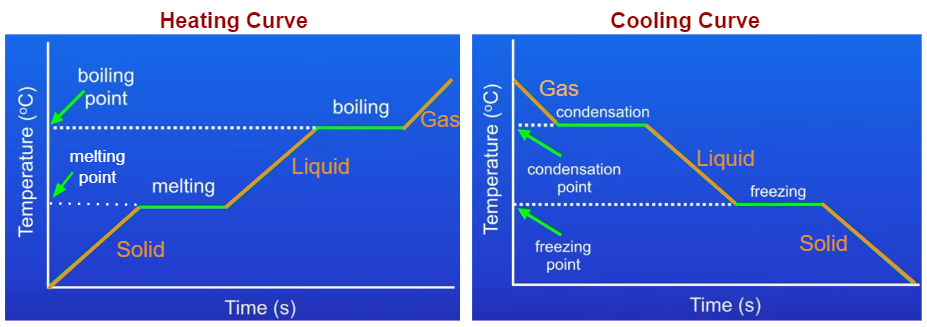
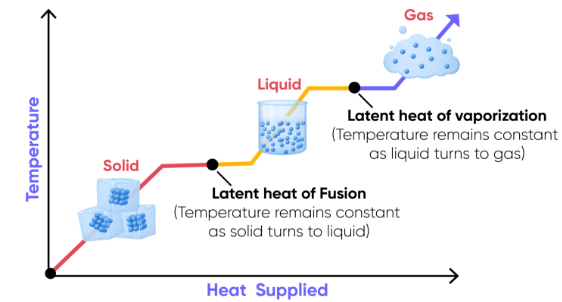
A heating curve shows how temperature changes as thermal energy is added to a substance. A cooling curve shows how temperature changes as thermal energy is removed.
Both graphs plot:
- Temperature on the y-axis
- Thermal energy added or removed on the x-axis
Key Features of Heating and Cooling Curves
Sloped Sections
- Substance is in a single phase
- Temperature changes as particle kinetic energy changes
- No phase change occurs
Flat (Plateau) Sections
- A phase change is occurring
- Temperature remains constant
- Energy is used to overcome or form attractions among particles
Typical Heating Curve for a Pure Substance
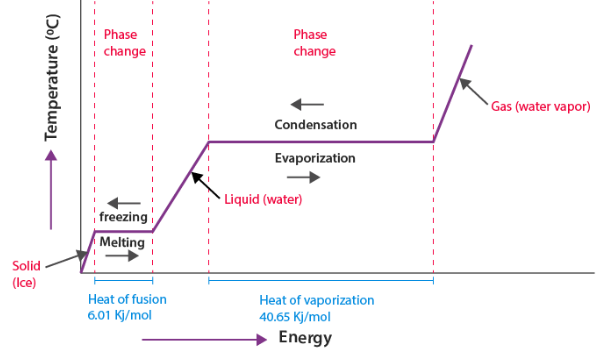
- Solid warms (temperature increases)
- Melting occurs (solid → liquid, flat region)
- Liquid warms
- Boiling occurs (liquid → gas, flat region)
- Gas warms
Cooling curves show the same regions but in reverse order.
Interpreting Heating and Cooling Curve Data
| Graph Region | Temperature Change | Particle Behavior |
|---|---|---|
| Sloped line | Changing | Particle speed increasing or decreasing |
| Flat plateau | Constant | Attractions breaking or forming |
Phase Diagrams of Pure Substances
A phase diagram shows the state of matter of a pure substance as a function of temperature and pressure.
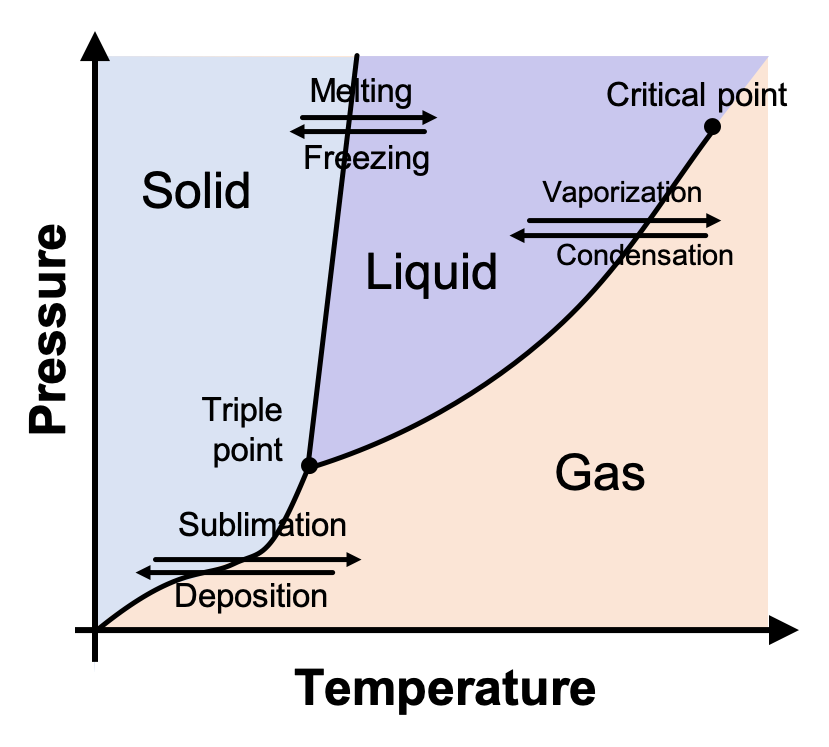
Phase diagrams allow scientists to predict which phase is present and when phase changes will occur.
Key Features of a Phase Diagram
- Regions: solid, liquid, and gas phases
- Boundary lines: conditions where two phases coexist
- Triple point: temperature and pressure where all three phases exist together
- Critical point: end of the liquid–gas boundary
Interpreting Phase Diagrams
| Diagram Feature | Meaning |
|---|---|
| Crossing a boundary line | Phase change occurs |
| Within a region | Single phase present |
| Triple point | Solid, liquid, and gas coexist |
Comparing Heating Curves and Phase Diagrams
- Heating/cooling curves show how a substance changes over time as energy is added or removed
- Phase diagrams show which phase exists at specific temperature–pressure conditions
Example
A heating curve shows a flat region at \( \mathrm{0^\circ C} \). Identify the phase change occurring and explain what happens to particle attractions.
▶️ Answer / Explanation
Melting is occurring.
Thermal energy is used to partially overcome attractions among particles, allowing them to move from fixed positions to sliding motion while temperature remains constant.
Example
A phase diagram shows a substance at a temperature and pressure just above the liquid–gas boundary. Predict the phase present and describe what happens if pressure is decreased at constant temperature.
▶️ Answer / Explanation
The substance is in the gas phase.
Decreasing pressure at constant temperature moves the system further into the gas region, meaning particles remain far apart with very weak attractions.
1.2.D.2 — Calculating Energy Transferred During a Phase Change
When a substance changes state, thermal energy is transferred to or from the substance. However, unlike temperature changes, this energy transfer is used to break or form attractions among particles, not to change particle speed.
The amount of energy transferred during a phase change depends on the mass of the substance and the specific latent heat for that phase change.
Key Idea: Temperature vs. Phase Change
- During a phase change, temperature remains constant
- Thermal energy goes into overcoming or forming particle attractions
- Energy transfer can still be calculated even though temperature does not change
Latent Heat
Latent heat is the amount of energy required to change the state of 1 gram of a substance without changing its temperature.
Common types of latent heat:
- Latent heat of fusion — solid ↔ liquid
- Latent heat of vaporization — liquid ↔ gas
Phase-Change Energy Equation
The energy transferred during a phase change is calculated using: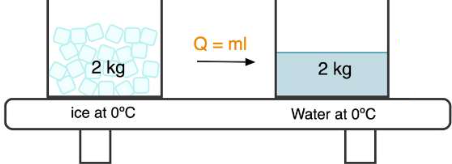
\( \mathrm{q = m L} \)
Where:
- \( \mathrm{q} \) = energy transferred (\( \mathrm{J} \))
- \( \mathrm{m} \) = mass (\( \mathrm{g} \))
- \( \mathrm{L} \) = latent heat (\( \mathrm{J\,g^{-1}} \))
Sign Convention
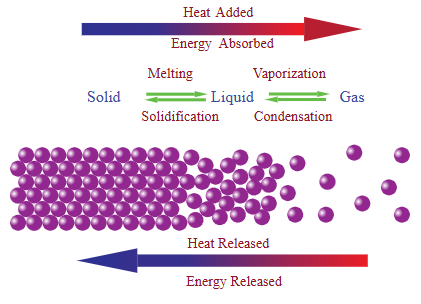
- Melting / vaporization: energy absorbed → \( \mathrm{q > 0} \)
- Freezing / condensation: energy released → \( \mathrm{q < 0} \)
The sign of \( \mathrm{q} \) indicates the direction of energy flow.
Comparing Temperature-Change vs. Phase-Change Calculations

| Situation | Equation Used | Temperature Change? |
|---|---|---|
| Warming or cooling | \( \mathrm{q = mc\Delta T} \) | Yes |
| Phase change | \( \mathrm{q = mL} \) | No |
Steps for Phase-Change Energy Calculations
- Identify the phase change (melting, boiling, freezing, condensing)
- Select the correct latent heat value
- Substitute values into \( \mathrm{q = mL} \)
- Apply the correct sign
- Report the result with proper units and precision
Example
Calculate the energy required to melt \( \mathrm{50.0\ g} \) of ice at \( \mathrm{0^\circ C} \). The latent heat of fusion of water is \( \mathrm{334\ J\,g^{-1}} \).
▶️ Answer / Explanation
Use the phase-change equation:
\( \mathrm{q = mL} \)
\( \mathrm{q = 50.0 \times 334} \)
\( \mathrm{q = 1.67 \times 10^{4}\ J} \)
Energy is absorbed during melting, so \( \mathrm{q > 0} \).
Example
A \( \mathrm{25.0\ g} \) sample of steam at \( \mathrm{100^\circ C} \) condenses completely into liquid water. Calculate the energy transferred. The latent heat of vaporization of water is \( \mathrm{2260\ J\,g^{-1}} \).
▶️ Answer / Explanation
Use the equation:
\( \mathrm{q = mL} \)
\( \mathrm{q = 25.0 \times 2260} \)
\( \mathrm{q = 5.65 \times 10^{4}\ J} \)
Condensation releases energy, so:
\( \mathrm{q = -5.65 \times 10^{4}\ J} \)