Pre AP Chemistry -1.2D Heating Curves and Phase Diagrams- MCQ Exam Style Questions -New Syllabus 2025-2026
Pre AP Chemistry -1.2D Heating Curves and Phase Diagrams- MCQ Exam Style Questions – New Syllabus 2025-2026
Pre AP Chemistry -1.2D Heating Curves and Phase Diagrams- MCQ Exam Style Questions – Pre AP Chemistry – per latest Pre AP Chemistry Syllabus.
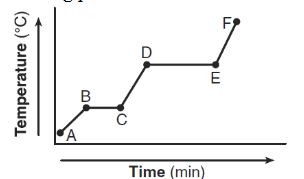
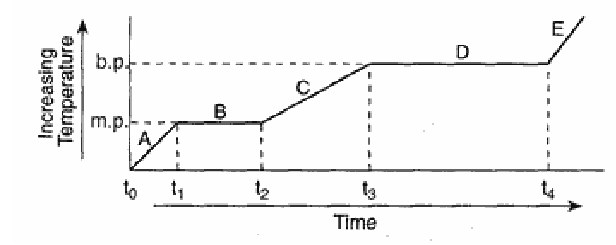
The heating curve below represents a sample of a substance startFing as a solid below its melting point and being heated over a period of time.
Which statement describes the energy of the particles in this sample during interval DE?
A) Both potential energy and average kinetic energy increase.
B) Both potential energy and average kinetic energy decrease.
C) Potential energy increases and average kinetic energy remains the same.
D) Potential energy remains the same and average kinetic energy increases.
▶️ Answer/Explanation
During interval DE, the substance is undergoing a phase change at constant temperature.
When temperature remains constant, the average kinetic energy remains the same, but the potential energy increases as particles move further apart.
Ans: C
The graph below represents the relationship between time and temperature as heat is added at a constant rate to a sample of a substance.
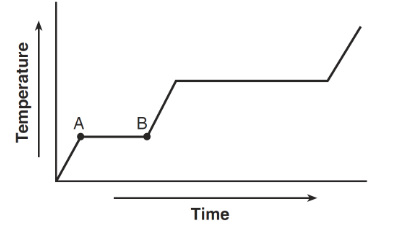
During interval AB, which energy change occurs for the particles in this sample?
A) The potential energy of the particles increases.
B) The potential energy of the particles decreases.
C) The average kinetic energy of the particles increases.
D) The average kinetic energy of the particles decreases.
▶️ Answer/Explanation
During interval AB, the temperature is constant.
When temperature remains constant during heating, the potential energy increases while the average kinetic energy remains the same.
Ans: A
Given the cooling curve of a substance:
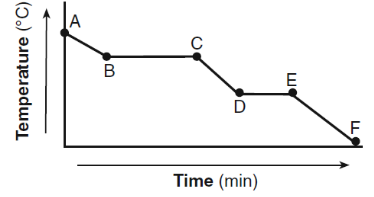
During which intervals is potential energy decreasing and average kinetic energy remaining constant?
A) AB and BC
B) AB and CD
C) DE and BC
D) DE and EF
▶️ Answer/Explanation
During a phase change on a cooling curve, the temperature remains constant.
When temperature remains constant during cooling:
- Average kinetic energy remains the same
- Potential energy decreases as particles move closer together
The intervals that represent this condition are DE and BC.
Ans: C
Given the diagram representing a heating curve for a substance:
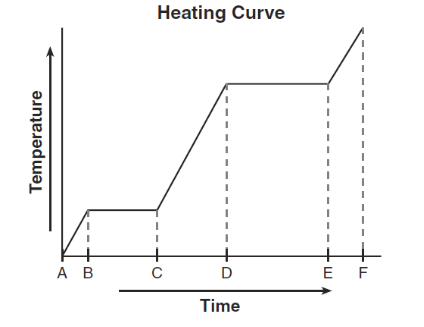
During which time interval is the average kinetic energy of the particles constant while the potential energy of the particles increases?
A) AC
B) BC
C) CD
D) DF
▶️ Answer/Explanation
On a heating curve, when the temperature remains constant, the substance is undergoing a phase change.
- Average kinetic energy remains constant (because temperature is constant).
- Potential energy increases as particles move further apart.
This occurs during interval BC.
Ans: B
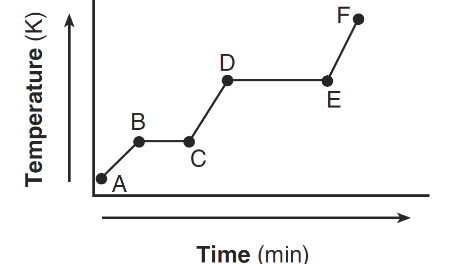
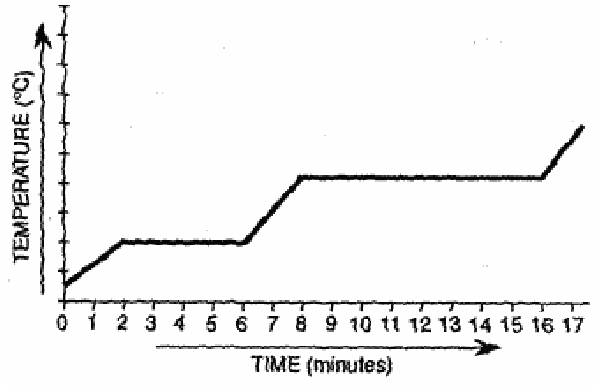
The graph below represents the uniform heating of a sample of a substance starting as a solid below its melting point.
Which statement describes what happens to the energy of the particles of the sample during time interval DE?
A) Potential energy decreases and average kinetic energy increases.
B) Potential energy increases and average kinetic energy increases.
C) Potential energy increases and average kinetic energy remains the same.
D) Potential energy remains the same and average kinetic energy increases.
▶️ Answer/Explanation
During interval DE, the temperature is constant, indicating a phase change.
- Average kinetic energy remains the same (temperature does not change).
- Potential energy increases as particles move farther apart.
Ans: C
The graph below represents the relationship between temperature and time as heat is added to a sample of H2O.
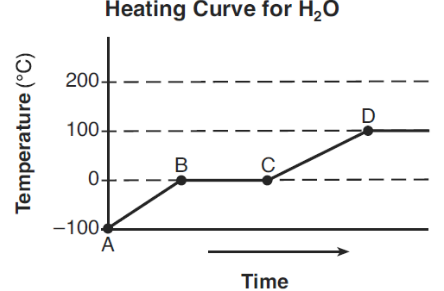
Which statement correctly describes the energy of the particles of the sample during interval BC?
A) Average kinetic energy increases and potential energy remains the same.
B) Average kinetic energy decreases and potential energy remains the same.
C) Average kinetic energy remains the same and potential energy increases.
D) Average kinetic energy remains the same and potential energy decreases.
▶️ Answer/Explanation
During interval BC, the temperature remains constant, indicating a phase change.
- Average kinetic energy remains the same (because temperature is constant).
- Potential energy increases as intermolecular forces are overcome.
Ans: C
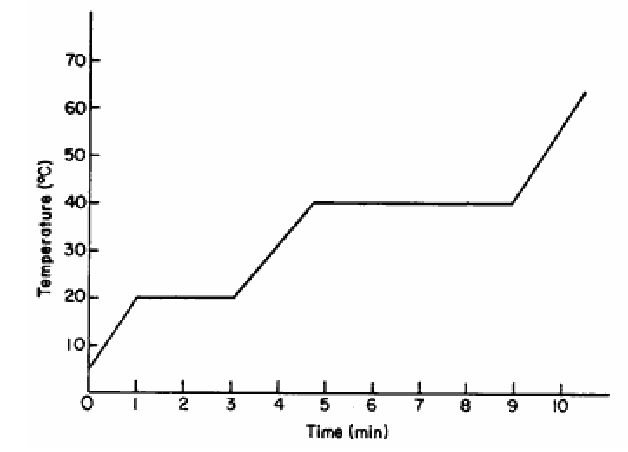
Starting as a solid, a sample of a substance is heated at a constant rate. The graph below shows the changes in temperature of this sample.
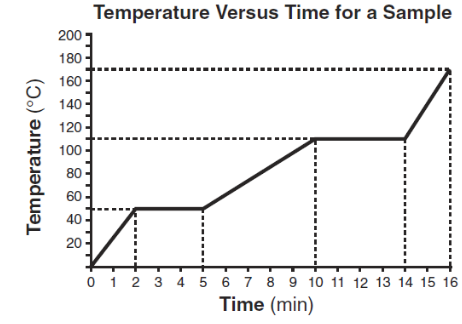
What is the melting point of the sample and the total time required to completely melt the sample after it has reached its melting point?
A) 50°C and 3 min
B) 50°C and 5 min
C) 110°C and 4 min
D) 110°C and 14 min
▶️ Answer/Explanation
The melting point is the temperature at which the graph becomes horizontal for the first time.
From the graph:
- The melting point is 50°C.
- The time taken to completely melt after reaching the melting point is 3 minutes.
Ans: A
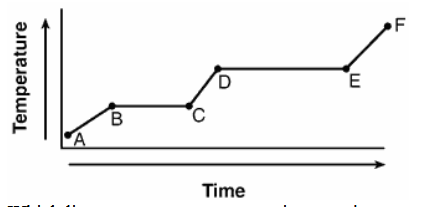
The graph below represents the uniform heating of a substance, starting below its melting point, when the substance is solid.
Which line segments represent an increase in average kinetic energy?
A) AB and CD
B) AB and DE
C) BC and EF
D) CD and EF
▶️ Answer/Explanation
Average kinetic energy increases when the temperature increases.
On a heating curve, slanted (rising) segments represent increasing temperature.
The segments that show increasing temperature are AB and DE.
Ans: B
The graph below represents the uniform heating of a substance, starting with the substance as a solid below its melting point.
Which line segment represents an increase in potential energy and no change in average kinetic energy?
A) AB
B) BC
C) CD
D) DE
▶️ Answer/Explanation
During a phase change:
- Temperature remains constant
- Average kinetic energy remains constant
- Potential energy increases
The segment that represents this condition is BC.
Ans: B
The graph below represents the heating curve of a substance that starts as a solid below its freezing point.
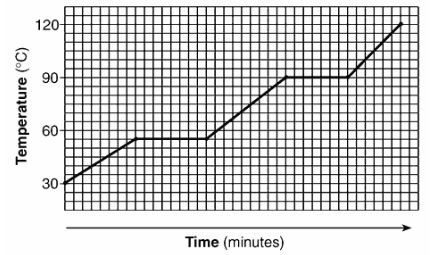
What is the melting point of this substance?
A) 30°C
B) 55°C
C) 90°C
D) 120°C
▶️ Answer/Explanation
The melting point is the temperature at the first horizontal (constant temperature) section of the heating curve.
From the graph, this temperature is 55°C.
Ans: B
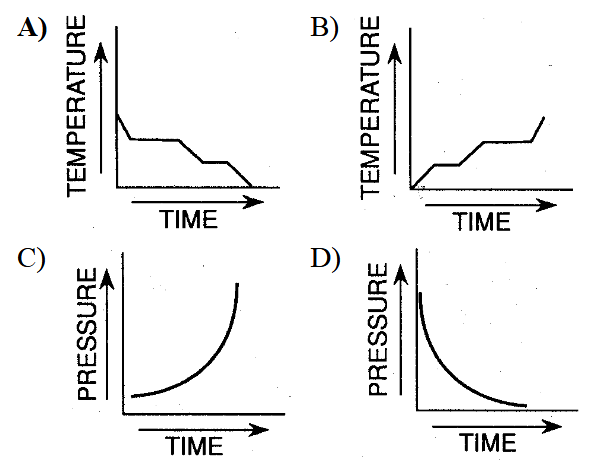
Which graph could represent the uniform cooling of a substance, starting with the gaseous phase and ending with the solid phase?
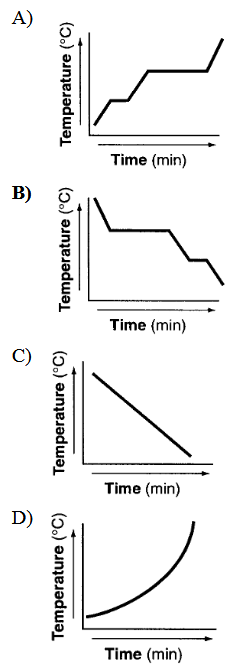
A) Graph A
B) Graph B
C) Graph C
D) Graph D
▶️ Answer/Explanation
During uniform cooling from gas to solid, the graph should show:
- A decreasing temperature (downward slope)
- A horizontal section for condensation (gas → liquid)
- Another horizontal section for freezing (liquid → solid)
The graph that correctly shows this pattern is Graph B.
Ans: B
The table below shows the data collected by a student as heat was applied at a constant rate to a solid below its freezing point.
What is the boiling point of this substance?
A) AB
B) BC
C) CD
D) DE
▶️ Answer/Explanation
The boiling point is identified at the second horizontal (constant temperature) section of the heating data.
From the given information, this corresponds to interval BC.
Ans: B
The graph below represents the uniform cooling of a substance, starting with the substance as a gas above its boiling point.
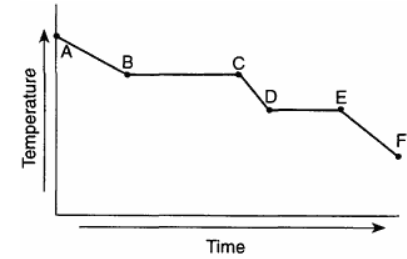
During which interval is the substance completely in the liquid phase?
A) AB and CD
B) BC and DE
C) AB and EF
D) CD and EF
▶️ Answer/Explanation
On a cooling curve:
- The first horizontal section represents condensation (gas → liquid).
- The slanted section after condensation represents the liquid phase only.
- The next horizontal section represents freezing (liquid → solid).
The substance is completely liquid during interval CD.
The correct choice including this interval is CD and EF.
Ans: D
The graph below represents the uniform cooling of water at 1 atmosphere, starting with water as a gas above its boiling point.
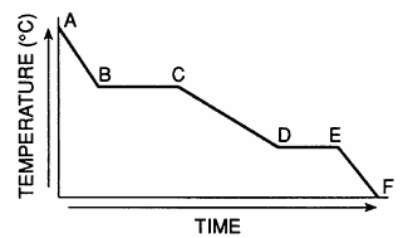
Which segments of the cooling curve represent the fixed points on a thermometer?
A) AB and CD
B) BC and DE
C) AB and EF
D) CD and EF
▶️ Answer/Explanation
The fixed points on a thermometer are:
- 0°C (freezing point of water)
- 100°C (boiling point of water)
On a cooling curve, these are shown as horizontal (constant temperature) segments.
The segments representing these fixed points are BC and DE.
Ans: B
A student obtained the following data while cooling a substance. The substance was originally in the liquid phase at a temperature below its boiling point.
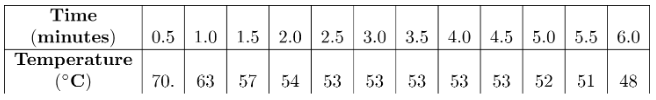
What is the freezing point of the substance?
A) 70°C
B) 59°C
C) 53°C
D) 48°C
▶️ Answer/Explanation
The freezing point is identified by the constant temperature (horizontal plateau) during cooling.
From 2.5 minutes to 4.5 minutes, the temperature remains constant at 53°C.
This indicates the phase change (liquid → solid).
Ans: C) 53°C
Base your answers to questions on the graph below, which represents uniform cooling of a sample of a pure substance, starting as a gas.
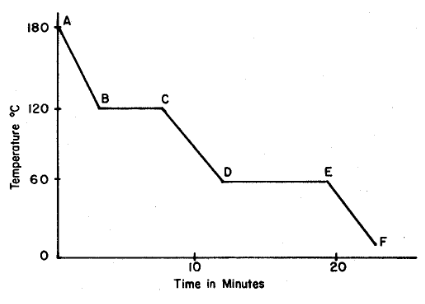
Solid and liquid phases can exist in equilibrium between points
A) E and F
B) B and C
C) C and D
D) D and E
▶️ Answer/Explanation
Solid–liquid equilibrium occurs during the freezing process. On a cooling curve, this is shown by a horizontal (constant temperature) segment.
On the given graph, this occurs between D and E.
Ans: D
Base your answers to questions 16 and 17 on the graph below, which represents uniform cooling of a sample of a pure substance, starting as a gas.
The boiling point of the substance is
A) 10°C
B) 60°C
C) 120°C
D) 180°C
▶️ Answer/Explanation
The boiling point is the temperature at which gas changes to liquid. On a cooling curve, this is shown by the first horizontal (constant temperature) segment.
On the graph, this occurs at 120°C.
Ans: C
As a solid is heated, its temperature increases from 10°C to 25°C, remains at 25°C for 5 minutes, and then increases to beyond 45°C. Based on this information, what conclusion can be drawn about the substance?
A) Its melting point is 45°C.
B) Its boiling point is 45°C.
C) Its melting point is 25°C.
D) Its boiling point is 25°C.
▶️ Answer/Explanation
When temperature remains constant during heating, a phase change is occurring.
The constant temperature at 25°C indicates the melting point.
After melting is complete, the temperature increases again.
Ans: C
A student observing the behavior of paradichlorobenzene first heats 10 grams of the substance in a hot water bath until it is completely liquefied. The following data are recorded as paradichlorobenzene cools.
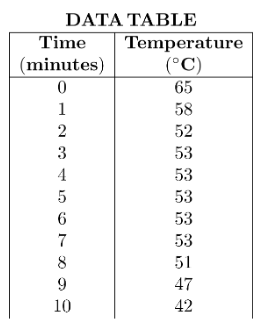
What is the freezing point of paradichlorobenzene?
A) 42°C
B) 53°C
C) 58°C
D) 65°C
▶️ Answer/Explanation
The freezing point is identified by the constant temperature during cooling.
The temperature remains constant at 53°C from minutes 3 to 7.
This indicates the liquid → solid phase change.
Ans: B
The graph below represents the relationship between temperature and time as heat is added uniformly to a substance, starting when the substance is a solid below its melting point.
Which portions of the graph represent times when heat is absorbed and potential energy increases while kinetic energy remains constant?
A) A and B
B) B and D
C) A and C
D) C and D
▶️ Answer/Explanation
When potential energy increases while kinetic energy remains constant, a phase change is occurring.
On a heating curve, phase changes are represented by horizontal segments where temperature remains constant.
On the given graph, these occur during segments B and D.
Ans: B
A substance is heated at a constant rate. The temperature of the substance remains constant for a period of time during the heating process.
What is happening to the substance during this time?
A) The particles are increasing in size.
B) The particles are gaining kinetic energy.
C) The particles are moving further apart.
D) The particles are increasing in number.
▶️ Answer/Explanation
When temperature remains constant during heating, a phase change is occurring.
During a phase change, kinetic energy remains constant, but potential energy increases as particles move further apart.
Ans: C
Which graph best represents a change of phase from a gas to a solid?
A) Graph A
B) Graph B
C) Graph C
D) Graph D
▶️ Answer/Explanation
Gas → Solid is called deposition.
During a phase change, temperature remains constant while energy is released.
Graph A shows temperature decreasing with flat sections (phase changes).
Ans: A
The graph below represents changes of state for an unknown substance.
What is the boiling temperature of the substance?
A) 0°C
B) 20°C
C) 70°C
D) 40°C
▶️ Answer/Explanation
The boiling point is identified by the flat (constant temperature) section at the higher temperature.
The graph shows a horizontal section at 40°C.
This represents boiling.
Ans: D
The graph below was constructed by a student to show the relationship between temperature and time as heat was uniformly added to a solid below its melting point.
What is the total length of time that the solid phase existed with the liquid phase?
A) 6 min
B) 10 min
C) 8 min
D) 4 min
▶️ Answer/Explanation
The solid and liquid coexist during the flat (constant temperature) section of the graph.
From the graph, the melting plateau lasts from minute 2 to minute 6.
Total time = 6 − 2 = 4 minutes.
Ans: D
A gas changes directly to a solid during
A. fusion
B. deposition
C. saponification
D. decomposition
▶️ Answer/Explanation
Gas → Solid directly is called deposition.
Ans: B
A beaker with water and the surrounding air are all at 24°C. After ice cubes are placed in the water, heat is transferred from
A. the ice cubes to the air
B. the beaker to the air
C. the water to the ice cubes
D. the water to the beaker
▶️ Answer/Explanation
Heat flows from higher temperature to lower temperature.
The water (24°C) transfers heat to the colder ice.
Ans: C
Which element has a melting point higher than the melting point of rhenium?
A. iridium
B. osmium
C. tantalum
D. tungsten
▶️ Answer/Explanation
Tungsten has one of the highest melting points of all elements.
Ans: D
Which processes represent one chemical change and one physical change?
A. freezing and melting
B. freezing and vaporization
C. decomposition and melting
D. decomposition and combustion
▶️ Answer/Explanation
Melting is physical. Decomposition is chemical.
Ans: C
Which statement describes the transfer of heat energy when an ice cube is added to water at 25°C?
A. Both lose heat energy
B. Both gain heat energy
C. Ice gains heat, water loses heat
D. Ice loses heat, water gains heat
▶️ Answer/Explanation
Heat flows from warm water to cold ice.
Ans: C
At which Celsius temperature does lead change from a solid to a liquid?
A. 874°C
B. 601°C
C. 328°C
D. 0°C
▶️ Answer/Explanation
The melting point of lead is approximately 328°C.
Ans: C