Pre AP Chemistry -1.3C Quantitative Gas Relationships- MCQ Exam Style Questions -New Syllabus 2025-2026
Pre AP Chemistry -1.3C Quantitative Gas Relationships- MCQ Exam Style Questions – New Syllabus 2025-2026
Pre AP Chemistry -1.3C Quantitative Gas Relationships- MCQ Exam Style Questions – Pre AP Chemistry – per latest Pre AP Chemistry Syllabus.
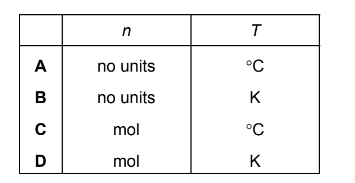
In the ideal gas equation, \( pV = nRT \), what are the units of n and T?
▶️ Answer/Explanation
In the equation:
\( pV = nRT \)
n represents the amount of substance, measured in moles (mol).
T represents the absolute temperature, measured in kelvin (K).
Therefore, the correct option is the one stating:
n → mol
T → K
Answer: D
The general gas equation can be used to calculate the \( M_r \) value of a gas.
For a sample of a gas of mass m g, which expression will give the value of \( M_r \)?

▶️ Answer/Explanation
Start with the ideal gas equation:
\( pV = nRT \)
Number of moles:
\( n = \frac{m}{M_r} \)
Substitute into the gas equation:
\( pV = \frac{m}{M_r} RT \)
Rearranging for \( M_r \):
\( M_r = \frac{mRT}{pV} \)
The option that matches this expression is B.
Ans: B
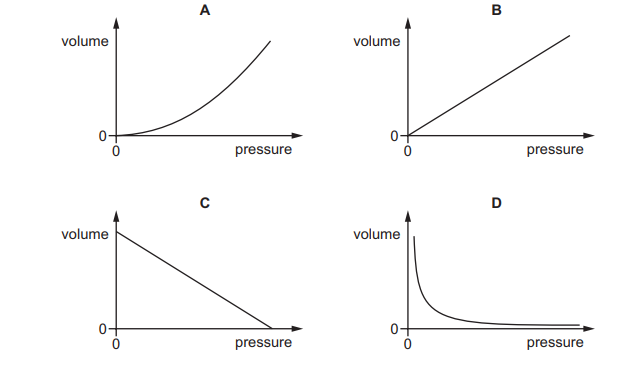
Which graph shows how the volume of a fixed mass of gas at constant temperature varies with its pressure?
▶️ Answer/Explanation
At constant temperature, a fixed mass of gas obeys Boyle’s Law:
\( PV = \text{constant} \)
This means:
\( V \propto \frac{1}{P} \)
So, as pressure increases, volume decreases in a curved (inverse) relationship.
The correct graph must show a downward-curving hyperbola.
Ans: D
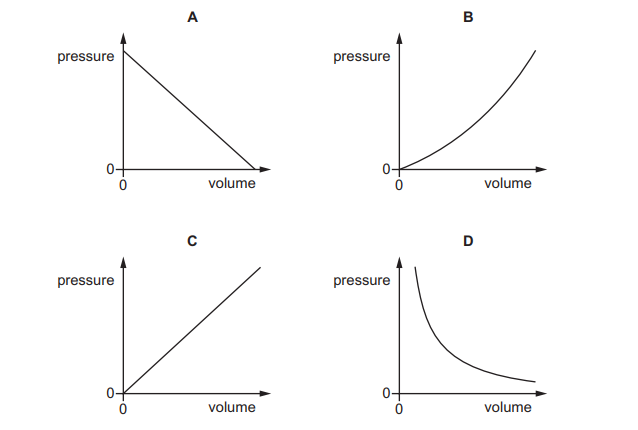
Which graph shows the relationship between the pressure and volume of a fixed mass of gas at constant temperature?
▶️ Answer/Explanation
For a fixed mass of gas at constant temperature, Boyle’s Law applies:
\( PV = \text{constant} \)
This gives:
\( P \propto \frac{1}{V} \)
So the pressure–volume graph must be an inverse curve (a rectangular hyperbola).
The correct graph showing this curved inverse relationship is D.
Ans: D
A substance loses thermal energy (heat) to the surroundings at a steady rate.
The graph shows how the temperature of the substance changes with time.
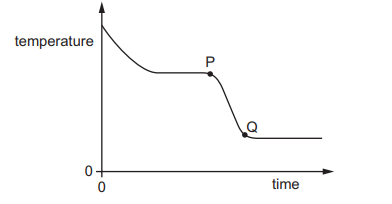
What could the portion PQ of the graph represent?
A. gas condensing
B. gas cooling
C. liquid cooling
D. liquid solidifying
▶️ Answer/Explanation
When a substance cools at a steady rate:
- A sloping line means temperature is decreasing → cooling within one state.
- A flat (horizontal) line means temperature is constant → change of state.
Portion PQ is a sloping line, so the substance is cooling without changing state.
This represents a liquid losing thermal energy and its temperature decreasing.
Ans: C
Air in a sealed syringe is slowly compressed by moving the piston. The temperature of the air stays the same.
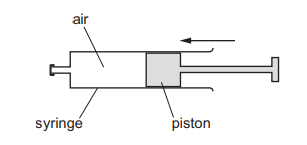
Which statement about the air is correct?
A The pressure of the air decreases because its molecules now travel more slowly.
B The pressure of the air decreases because the area of the syringe walls is now smaller.
C The pressure of the air increases because its molecules now hit the syringe walls more frequently.
D The pressure of the air increases because its molecules now travel more quickly.
▶️ Answer/Explanation
Since temperature remains constant, the average kinetic energy (and speed) of the molecules does not change.
When the volume is reduced, the molecules have less space and collide with the walls more frequently.
More frequent collisions increase the force on the walls, so the pressure increases (Boyle’s Law).
Ans: C
A gas storage tank has a fixed volume. The graph shows how the temperature of the gas in the tank varies with time.
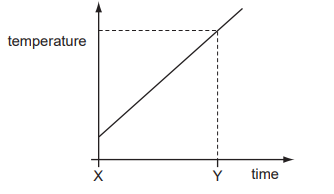
At time Y, the gas molecules are
A. closer together than at time X.
B. hitting the sides of the tank harder than at time X.
C. larger in size than at time X.
D. moving more slowly than at time X.
▶️ Answer/Explanation
The tank has a fixed volume, so the distance between molecules does not change significantly.
If temperature at time Y is higher than at time X, then:
- Average kinetic energy increases.
- Molecules move faster.
- They collide with the walls with greater force.
Therefore, at time Y the molecules are hitting the sides harder.
Ans: B
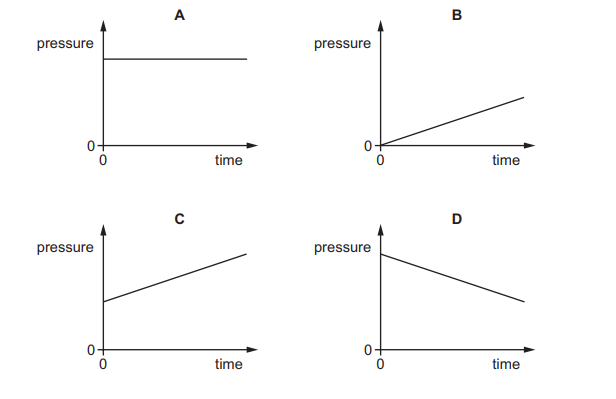
The pressure of a fixed mass of gas in a cylinder is measured. The temperature of the gas in the cylinder is then slowly increased. The volume of the cylinder does not change.
Which graph shows the pressure of the gas during this process?
▶️ Answer/Explanation
The volume is constant, so this is an example of the pressure–temperature relationship (Gay-Lussac’s Law).
\( P \propto T \) (when volume is constant)
As temperature increases, the average kinetic energy of the molecules increases.
Molecules collide with the walls more frequently and with greater force, so pressure increases linearly.
The correct graph must show a straight-line increase.
Ans: C
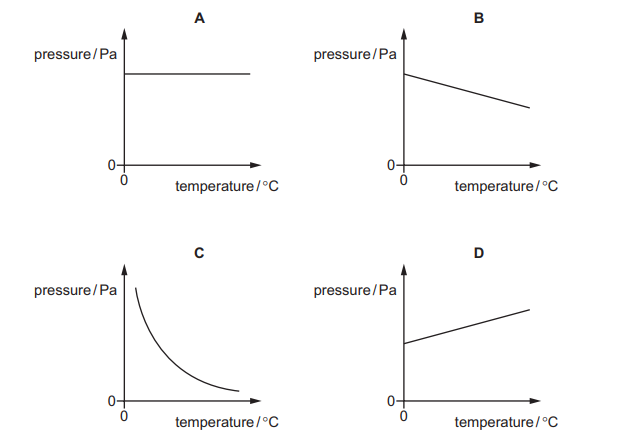
Some gas is trapped in a container of fixed volume. The temperature of the gas increases.
Which graph shows how the pressure of the gas changes with temperature?
▶️ Answer/Explanation
The volume is fixed, so Gay-Lussac’s Law applies:
\( P \propto T \) (for a fixed mass at constant volume)
This means pressure increases linearly with temperature (in kelvin).
The correct graph is the straight-line graph showing direct proportionality.
Ans: D
What is the relationship between temperatures in kelvin (T) and temperatures in degrees Celsius (\(\Theta\))?
A \(\Theta = T + 273\)
B \(\Theta = T – 273\)
C \(\Theta = T + 373\)
D \(\Theta = T – 373\)
▶️ Answer/Explanation
The relationship between kelvin and Celsius is:
\( T = \Theta + 273 \)
Rearranging to make \(\Theta\) the subject:
\( \Theta = T – 273 \)
Ans: B
Which row describes how the volume and mass of liquid mercury change as it is heated?
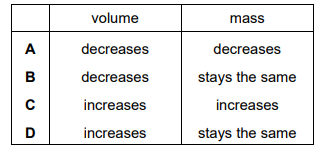
▶️ Answer/Explanation
When a liquid is heated:
- The particles gain kinetic energy and move slightly further apart.
- The liquid expands, so volume increases.
- No liquid is added or removed, so mass remains the same.
Therefore:
Volume increases, mass stays the same.
Ans: D