AP Physics Free Response Practice – Kinematics
Question
The first meters of a 100-meter dash are covered in 2 seconds by a sprinter who starts from rest and accelerates with a constant acceleration. The remaining 90 meters are run with the same velocity the sprinter had after 2 seconds.
a. Determine the sprinter’s constant acceleration during the first 2 seconds.
b. Determine the sprinters velocity after 2 seconds have elapsed.
c. Determine the total time needed to run the full 100 meters.
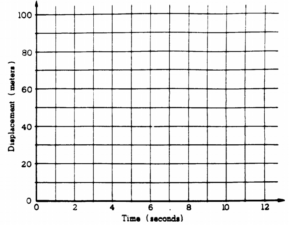
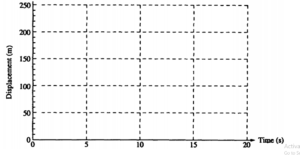
d. On the axes provided below, draw the displacement vs time curve for the sprinter.
Answer/Explanation
Ans:
a. For the first 2 seconds, while acceleration is constant, d = ½ at2 Substituting the given values d = 10 meters, t = 2 seconds gives a = 5 m/s2
b. The velocity after accelerating from rest for 2 seconds is given by v = at, so v = 10 m/s
c. The displacement, time, and constant velocity for the last 90 meters are related by d = vt.
To cover this distance takes t = d/v = 9 s. The total time is therefore 9 + 2 = 11 seconds
d. 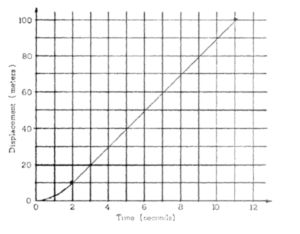
Question
A world-class runner can complete a 100 m dash in about 10 s. Past studies have shown that runners in such a race accelerate uniformly for a time t and then run at constant speed for the remainder of the race. A world-class runner is visiting your physics class. You are to develop a procedure that will allow you to determine the uniform acceleration a and an approximate value of t for the runner in a 100 m dash. By necessity your experiment will be done on a straight track and include your whole class of eleven students.
(a) By checking the line next to each appropriate item in the list below, select the equipment, other than the runner and the track, that your class will need to do the experiment.
____Stopwatches ____Tape measures ____ Rulers ____ Masking tape
____Metersticks ____ Starter’s pistol ____ String ____ Chalk
(b) Outline the procedure that you would use to determine a and t, including a labeled diagram of the experimental setup. Use symbols to identify carefully what measurements you would make and include in your procedure how you would use each piece of the equipment you checked in part (a).
(c) Outline the process of data analysis, including how you will identify the portion of the race that has uniform acceleration, and how you would calculate the uniform acceleration.
Answer/Explanation
Ans:
Two general approaches were used by most of the students.
Approach A: Spread the students out every 10 meters or so. The students each start their stopwatches as the runner starts and measure the time for the runner to reach their positions.
Analysis variant 1: Make a position vs. time graph. Fit the parabolic and linear parts of the graph and establish the position and time at which the parabola makes the transition to the straight line.
Analysis variant 2: Use the position and time measurements to determine a series of average velocities (vavg = Δx/Δt ) for the intervals. Graph these velocities vs. time to obtain a horizontal line and a line with positive slope.
Establish the position and time at which the sloped and horizontal lines intersect.
Analysis variant 3: Use the position and time measurements to determine a series of average accelerations (Δx =v0t + ½ at2. Graph these accelerations vs. time to obtain two horizontal lines, one with a nonzero value and one at zero acceleration. Establish the position and time at which the acceleration drops to zero.
Approach B: Concentrate the students at intervals at the end of the run, in order to get a very precise value of the constant speed vf, or at the beginning in order to get a precise value for a. The total distance D is given by a = ½ atu2 + vf(T – tu) , where T is the total measured run time. In addition vf = atu These equations can be solved for a and tu (if vf is measured directly) or vf and tu (if a is measured directly). Students may have also defined and used distances, speeds, and times for the accelerated and constant-speed portions of the run in deriving these relationships.
Question
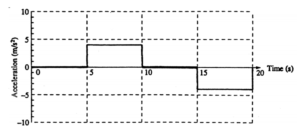
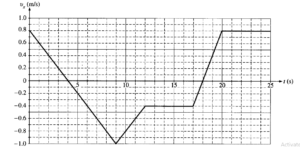
A student stands in an elevator and records his acceleration as a function of time. The data are shown in the graph above. At time t = 0, the elevator is at displacement x = 0 with velocity v = 0. Assume that the positive directions for displacement, velocity, and acceleration are upward.
a. Determine the velocity v of the elevator at the end of each 5-second interval.
i. Indicate your results by completing the following table.
Time Interval (s) 0–5 5–10 10–15 15–20
v (m/s) 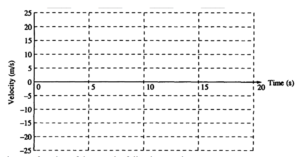
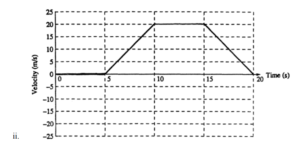
ii. Plot the velocity as a function of time on the following graph.
b. Determine the displacement x of the elevator above the starting point at the end of each 5-second interval.
i. Indicate your results by completing the following table.
Time Interval (s) 0–5 5–10 10–15 15–20
x (m) _____ _____ _____ _____
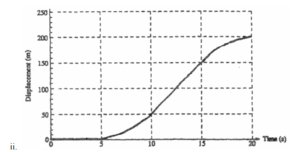
ii. Plot the displacement as a function of time on the following graph.
Answer/Explanation
Ans:
a. i. Use the kinematic equation applicable for constant acceleration: v = v0 + at. For each time interval, substitute the initial velocity for that interval, the appropriate acceleration from the graph and a time of 5 seconds.
5 seconds: v = 0 + (0)(5 s) = 0
10 seconds: v = 0 + (4 m/s2)(5 s) = 20 mls
15 seconds: v = 20 mls + (0)(5 s) = 20 mls
20 seconds: v = 20 mls + (-4 m/s2)(5 s) = 0
b. i. Use the kinematic equation applicable for constant acceleration, x = x0 + v0t + ½ at2
. For each time interval,
substitute the initial position for that interval, the initial velocity for that interval from part (a), the appropriate
acceleration, and a time of 5 seconds.
5 seconds: x = 0 + (0)(5 s) + ½ (0)(5 s)2 = 0
10 seconds: x = 0 + (0)(5 s) + ½ (4 m/s2)(5 s)2 = 50 m
15 seconds: x = 50 m + (20 m/s)(5 s) + ½ (0)(5 s)2 = 150 m
20 seconds: x = 150 m + (20 m/s)(5 s) + ½ (–4 m/s2)(5 s)2 = 200

Question
A ball of mass 0.5 kilogram, initially at rest, is kicked directly toward a fence from a point 32 meters away, as shown above. The velocity of the ball as it leaves the kicker’s foot is 20 meters per second at an angle of 37° above the horizontal. The top of the fence is 2.5 meters high. The ball hits nothing while in flight and air resistance is negligible.
a. Determine the time it takes for the ball to reach the plane of the fence.
b. Will the ball hit the fence? If so, how far below the top of the fence will it hit? If not, how far above the top of the fence will it pass?
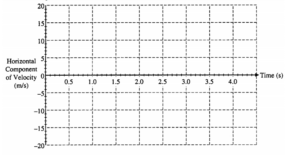
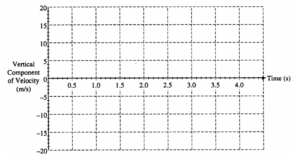
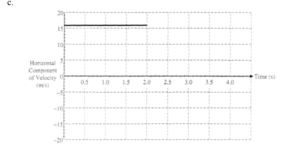
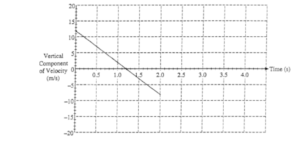
c. On the axes below, sketch the horizontal and vertical components of the velocity of the ball as functions of time until the ball reaches the plane of the fence.
Answer/Explanation
Ans:
a. The horizontal component of the velocity is constant so vxt = d where vx = v0 cos θ = 16 m/s t = d/v = 2 s
b. The height of the ball during its flight is given by y = v0yt + ½ gt2 where v0y = v0 sin θ = 12 m/s and g = –9.8
m/s2 which gives at t = 2 s, y = 4.4 m. The fence is 2.5 m high so the ball passes above the fence by 4.4 m – 2.5 m = 1.9 m
Question
A 0.50 kg cart moves on a straight horizontal track. The graph of velocity v versus time t for the cart is given below.
a. Indicate every time t for which the cart is at rest.
b. Indicate every time interval for which the speed (magnitude of velocity) of the cart is increasing.
c. Determine the horizontal position x of the cart at t = 9.0 s if the cart is located at x = 2.0 m at t = 0.
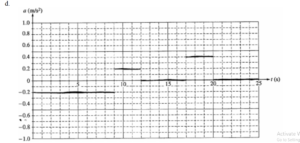
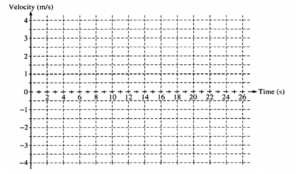
d. On the axes below, sketch the acceleration a versus time t graph for the motion of the cart from t = 0 to t = 25 s.
e. From t = 25 s until the cart reaches the end of the track, the cart continues with constant horizontal velocity. The cart leaves the end of the track and hits the floor, which is 0.40 m below the track. Neglecting air resistance, determine each of the following:
i. The time from when the cart leaves the track until it first hits the floor
ii. The horizontal distance from the end of the track to the point at which the cart first hits the floor
Answer/Explanation
Ans:
a. The car is at rest where the line crosses the t axis. At t = 4 s and 18 s.
b. The speed of the cart increases when the line moves away from the t axis (larger values of v, positive or negative). This occurs during the intervals t = 4 to 9 seconds and t = 18 to 20 seconds.
c. The change in position is equal to the area under the graph. From 0 to 4 seconds the area is positive and from 4 to 9 seconds the area is negative. The total area is –0.9 m. Adding this to the initial position gives x = x0 + Δx = 2.0 m + (–0.9 m) = 1.1 m
e. i. y = ½ gt2 (v0y = 0 m/s) gives t = 0.28 seconds.
ii. x = vxt = 0.22 m
Question
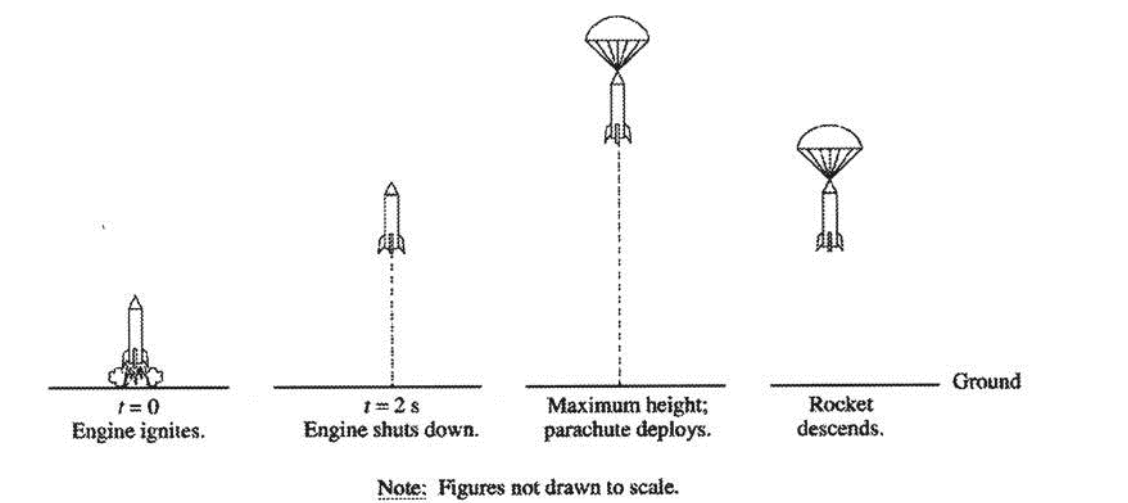
A model rocket is launched vertically with an engine that is ignited at time t = 0, as shown above. The engine provides an upward acceleration of 30 m/s2 for 2.0 s. Upon reaching its maximum height, the rocket deploys a parachute, and then descends vertically to the ground.
a. Determine the speed of the rocket after the 2 s firing of the engine.
b. What maximum height will the rocket reach?
c. At what time after t = 0 will the maximum height be reached?
Ans:
a. v1 = v0 + at = 60 m/s
b. The height of the rocket when the engine stops firing y1 = ½ at2 = 60 m
To determine the extra height after the firing stops, use vf2 = 0 m/s = v12 + 2(–g)y2 giving y2 = 180 m total height = y1 + y2 = 240 m
c. To determine the time of travel from when the engine stops firing use vf = 0 m/s = v1 + (–g)t2 giving t2 = 6 s. The total time is then 2 s + 6 s = 8 seconds
Question
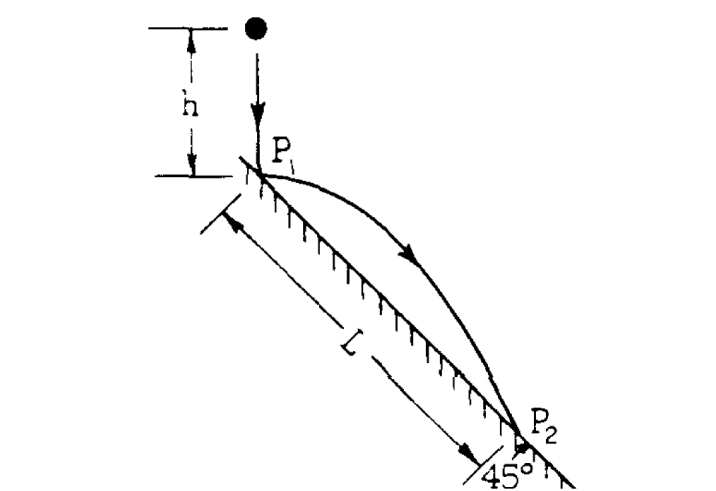
A ball of mass m is released from rest at a distance h above a frictionless plane inclined at an angle of 45° to the horizontal as shown above. The ball bounces horizontally off the plane at point P1 with the same speed with which it struck the plane and strikes the plane again at point P2. In terms of g and h determine each of the following quantities:
a. The speed of the ball just after it first bounces off the plane at P1.
b. The time the ball is in flight between points P1 and P2.
c. The distance L along the plane from P1 to P2.
d. The speed of the ball just before it strikes the plane at P2.
Answer/Explanation
Ans:
a. The speed after falling a height h is found from vf2 = vi2 + 2gh, where vi = 0 m/s giving vf = \(\sqrt{2gh}\)
b/c. During the flight from P1 to P2 the ball maintains a horizontal speed of \(\sqrt{2gh}\) and travels a horizontal distance of \(\frac{L}{\sqrt{2}}\) thus (using d = vt) we have \(\frac{L}{\sqrt{2}}\) = \(\sqrt{2gh}\) t. During the same time t the ball travels the same distance vertically given by \(\frac{L}{\sqrt{2}}\) = \(\frac{1}{2}gt^{2}\). Setting these expressions equal gives us \(\sqrt{2gh}\) t = ½ gt2 . Solving for t and substituting into the expression of L gives t = ![]()
d. During the flight from P1 to P2 the ball maintains a horizontal speed of \(\sqrt{2gh}\) and the vertical speed at P2 can be found from vy = vi + at where vi = 0, a = g and t is the time found above. Once vx and vy are known the speed is \(\sqrt{v_{x}^{2}=v_{y}^{2}}\) giving v = \(\sqrt{10gh}\)
Question
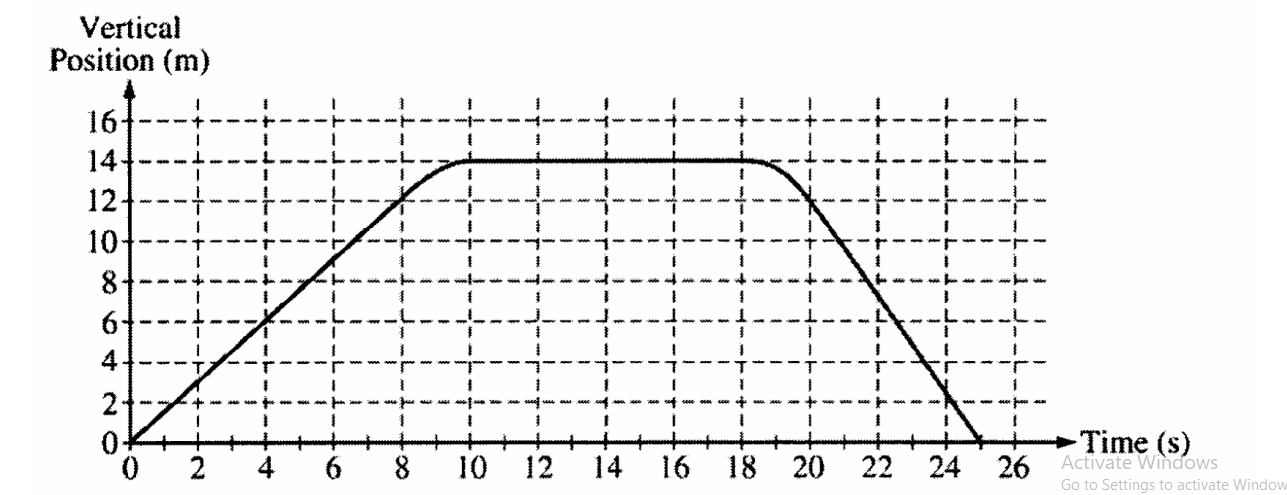
The vertical position of an elevator as a function of time is shown above.
a. On the grid below, graph the velocity of the elevator as a function of time.
b. i. Calculate the average acceleration for the time period t = 8 s to t = 10 s.
ii. On the box below that represents the elevator, draw a vector to represent the direction of this average acceleration.
Answer/Explanation
Ans:
a. 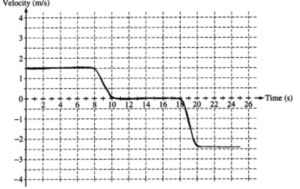
b. i. aavg = Δv/Δt = (0 – 1.5 m/s)/( 2 s) = – 0.75 m/s2
ii. 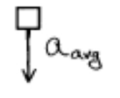
Question
A student wishing to determine experimentally the acceleration g due to gravity has an apparatus that holds a small steel sphere above a recording plate, as shown above. When the sphere is released, a timer automatically begins recording the time of fall. The timer automatically stops when the sphere strikes the recording plate.
The student measures the time of fall for different values of the distance D shown above and records the data in the table below. These data points are also plotted on the graph.
| Distance of Fall (m) | 0.10 | 0.50 | 1.00 | 1.70 | 2.00 |
| Time of Fall (s) | 0.14 | 0.32 | 0.46 | 0.59 | 0.63 |
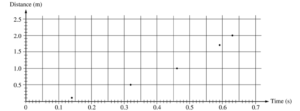
(a) On the grid above, sketch the smooth curve that best represents the student’s data The student can use these data for distance D and time t to produce a second graph from which the acceleration g due to gravity can be determined.
(b) If only the variables D and t are used, what quantities should the student graph in order to produce a linear relationship between the two quantities?
(c) On the grid below, plot the data points for the quantities you have identified in part (b), and sketch the best straight-line fit to the points. Label your axes and show the scale that you have chosen for the graph.
(d) Using the slope of your graph in part (c), calculate the acceleration g due to gravity in this experiment.
(e) State one way in which the student could improve the accuracy of the results if the experiment were to be performed again. Explain why this would improve the accuracy.
Answer/Explanation
Ans:
a. 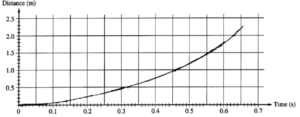
b. Distance and time are related by the equation D = ½ gt2. To yield a straight line, the quantities that should be graphed are D and t2 or \(\sqrt{D}\) and t
c. 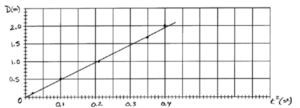
d. The slope of the graph of D vs. t2 is ½ g. The slope of the line shown is 4.9 m/s2 giving g = 9.8 m/s2
e. (example) Do several trials for each value of D and take averages. This reduces personal and random error.