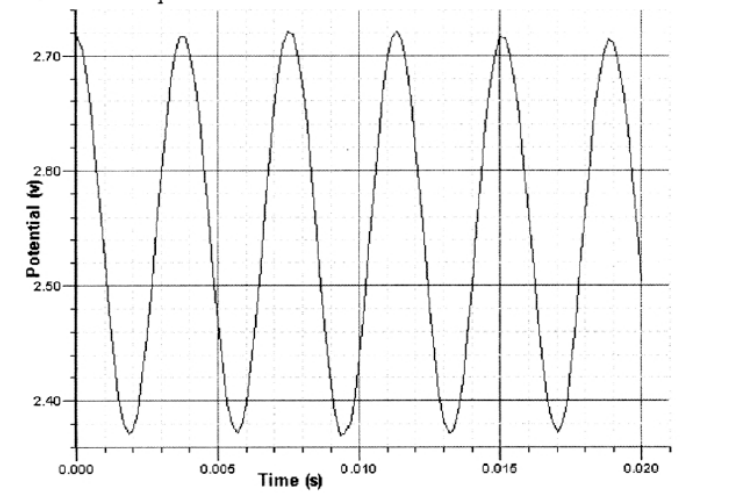
Questions The graph below was produced by a microphone in front of a tuning fork. It shows the voltage produced from the microphone as a function of time.

Question(a)
The frequency of the tuning fork is (approximately)
A) 0.004 s B) 0.020 s C) 50Hz D) 250 Hz
▶️Answer/Explanation
Ans: D
Solution: f = cycles / seconds
Question(b)
In order to calculate the speed of sound from the graph, you would also need to know
A) pitch B) wavelength C) frequency D) volume
▶️Answer/Explanation
Ans:B
Solution: To use v = f λ, you also need the λ
Questions

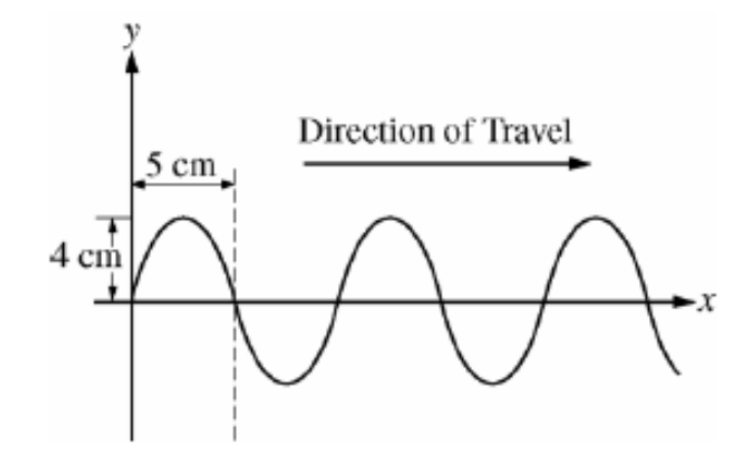
The figure above shows a transverse wave traveling to the right at a particular instant of time. The period of the wave is 0.2 s.
Question(a)
What is the amplitude of the wave?
A) 4 cm B) 5 cm C) 8 cm D) 10 cm
▶️Answer/Explanation
Ans: A
Solution: By inspection.
Question(b)
What is the speed of the wave?
A) 4 cm/s B) 25 cm/s C) 50 cm/s D) 100 cm/s
▶️Answer/Explanation
Ans: C
Solution: By inspection, the λ is 10 cm. f = 1 / T = 5, Then use v = f λ.
