Home / ap-precalculus-monthly-test-september-27-2024

Question 1

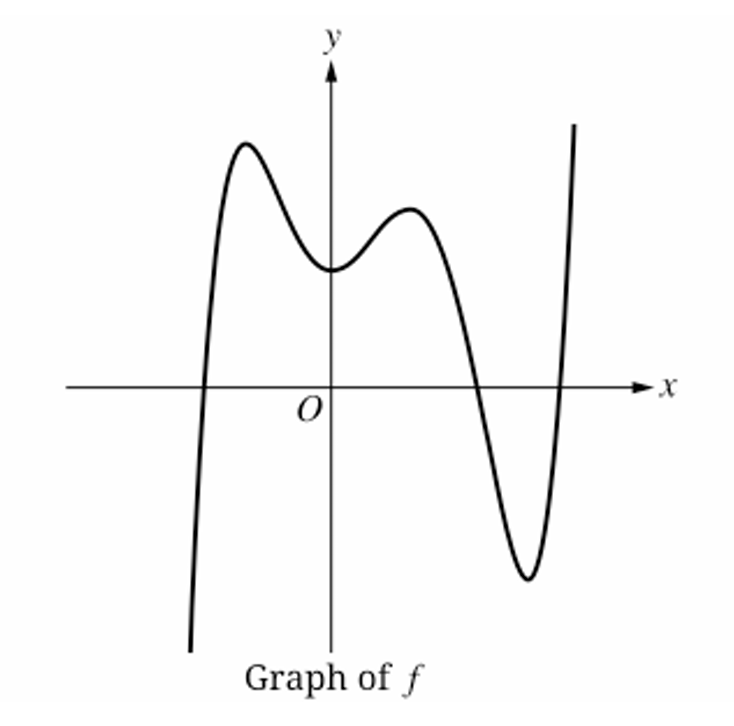
The graph of the polynomial function $f$ is shown. How many points of inflection does the graph of $f$ have on the given portion of the graph?
(A) One
(B) Three
(C) Four
(D) Five
▶️ Answer/Explanation
Detailed solution

A point of inflection occurs where the graph changes concavity (from concave up to concave down, or vice-versa).
Starting from the left, the graph begins concave down as it rises toward the first local maximum.
It switches to concave up to form the first local minimum near the $y$-axis (Point $1$).
It switches back to concave down to form the second local maximum (Point $2$).
It then switches to concave up to form the deep local minimum on the right (Point $3$).
Finally, it switches to concave down very briefly or stays concave up? Looking closely, the final upward stroke suggests a $4^{th}$ change in curvature (Point $4$).
Counting the transitions between the peaks and valleys, there are four distinct inflection points.
Correct Option: (C)
Question 2

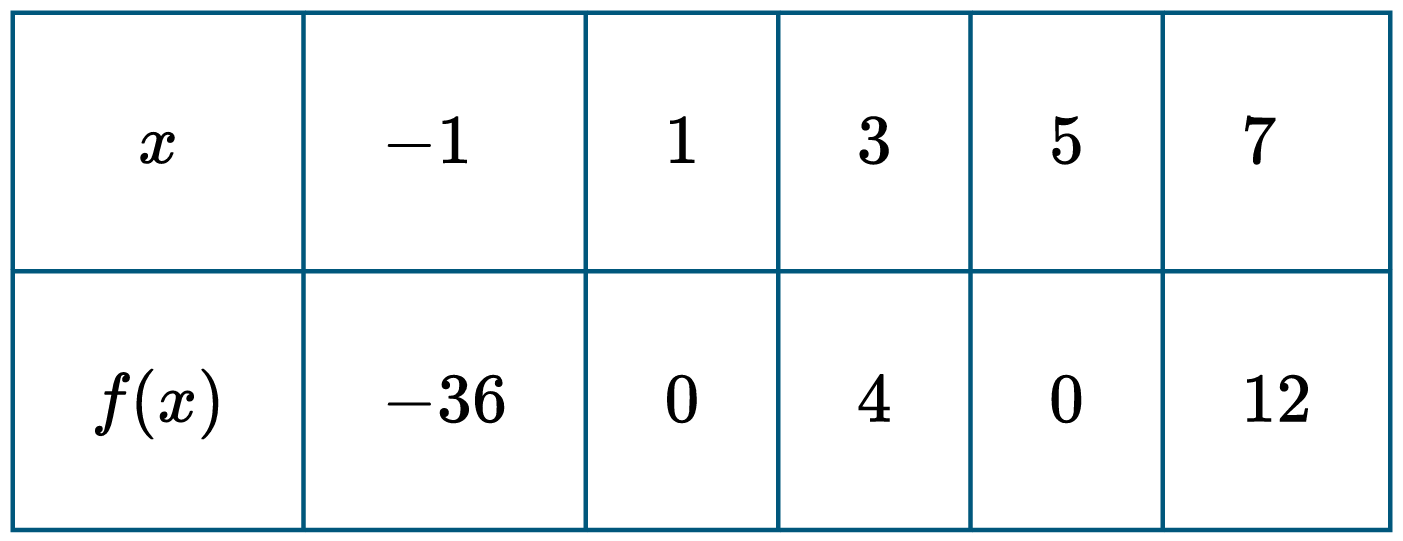
Values of the polynomial function $f$ for selected values of $x$ are given in the table. If all of the zeros of the function $f$ are given in the table, which of the following must be true?
(A) The function $f$ has a local minimum at $(-1, -36)$.
(B) The function $f$ has a local minimum at $(5, 0)$.
(C) The function $f$ has a local maximum at $(3, 4)$.
(D) The function $f$ has a local maximum at $(1, 0)$.
▶️ Answer/Explanation
Detailed solution

The table shows zeros at $x = 1$ and $x = 5$, where $f(1) = 0$ and $f(5) = 0$.
Between these zeros, at $x = 3$, the function is positive ($f(3) = 4$).
For $x < 1$, specifically at $x = -1$, the function is negative ($f(-1) = -36$).
For $x > 5$, specifically at $x = 7$, the function is positive ($f(7) = 12$).
Since $f(x)$ must cross or touch the x-axis only at $x=1$ and $x=5$, the sign change at $x=1$ (negative to positive) indicates it is not a maximum.
However, at $x = 5$, the function goes from positive ($f(3)=4$) to zero ($f(5)=0$) and back to positive ($f(7)=12$).
This means $f(x)$ touches the x-axis at $(5, 0)$ without crossing it, staying $\ge 0$ in that interval.
Therefore, $(5, 0)$ must be a local minimum.
Question 3

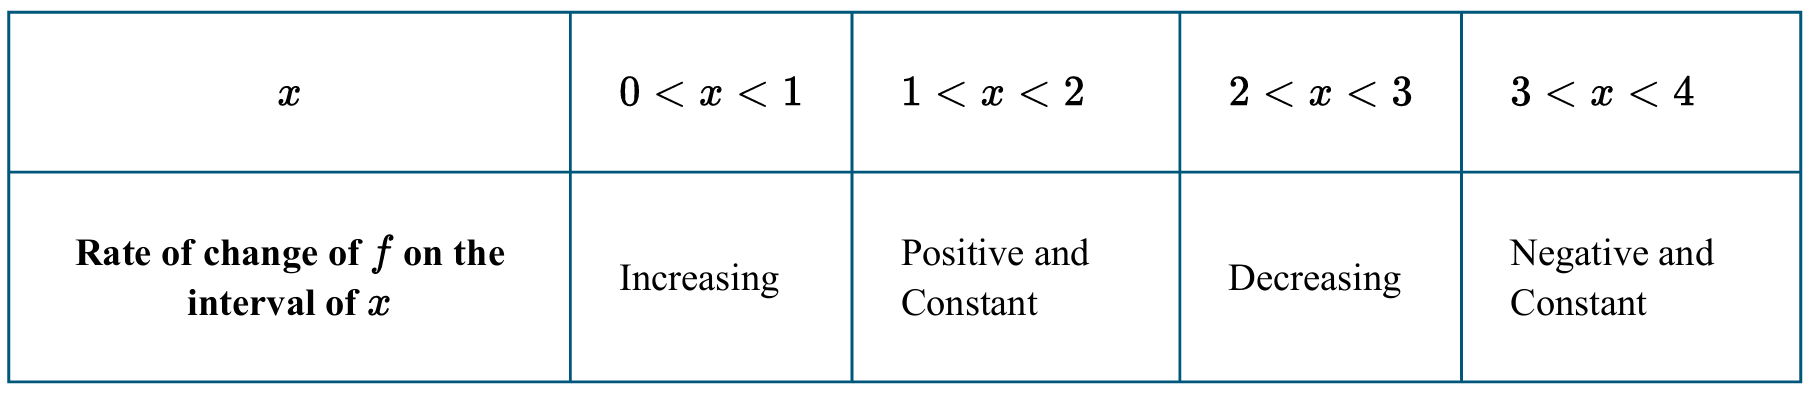
The table describes rates of change of a function $f$ for selected intervals of $x$. The function $f$ is defined for $0 \le x \le 4$. On which of the following intervals is the graph of $f$ concave down?
(A) $0 < x < 1$
(B) $1 < x < 2$
(C) $2 < x < 3$
(D) $3 < x < 4$
▶️ Answer/Explanation
Detailed solution

The concavity of a function $f$ is determined by the behavior of its rate of change, $f’$.
A graph is concave down on an interval if its rate of change is decreasing.
In the interval $0 < x < 1$, the rate of change is increasing, so $f$ is concave up.
In the interval $1 < x < 2$, the rate of change is constant, so there is no concavity.
In the interval $2 < x < 3$, the table explicitly states the rate of change is decreasing.
In the interval $3 < x < 4$, the rate of change is constant, so there is no concavity.
Therefore, the graph of $f$ is concave down only on the interval $2 < x < 3$.
Correct Option: (C)
Question 4

Jordan’s cell phone plan includes $5$ gigabytes (GB) of data per month and has a monthly cost of $\$79.95$. If Jordan uses more than $5$ GB of data within the month, there is a charge of $\$10$ per additional gigabyte of data used. Function $C$ is used to model Jordan’s monthly cell phone bill, where $d$ is the number of gigabytes of data used and $C(d)$ is the cost in dollars. Which of the following defines function $C$?
(A) $C(d) = \begin{cases} 79.95 & \text{for } 0 \le d \le 5 \\ 79.95 + 10(d – 5) & \text{for } d > 5 \end{cases}$
(B) $C(d) = \begin{cases} 79.95 & \text{for } 0 \le d \le 5 \\ 79.95 + 10d & \text{for } d > 5 \end{cases}$
(C) $C(d) = \begin{cases} 79.95 & \text{for } 0 \le d \le 5 \\ 79.95d + 10 & \text{for } d > 5 \end{cases}$
▶️ Answer/Explanation
Detailed solution

The correct option is (A).
For data usage $0 \le d \le 5$, the cost is a constant flat rate of $\$79.95$.
For data usage $d > 5$, the “additional” data used is calculated as $(d – 5)$.
The extra charge is the rate of $\$10$ multiplied by these additional gigabytes: $10(d – 5)$.
The total cost for $d > 5$ is the base cost plus the extra charge: $79.95 + 10(d – 5)$.
This matches the piecewise structure shown in Option (A).

Question 5

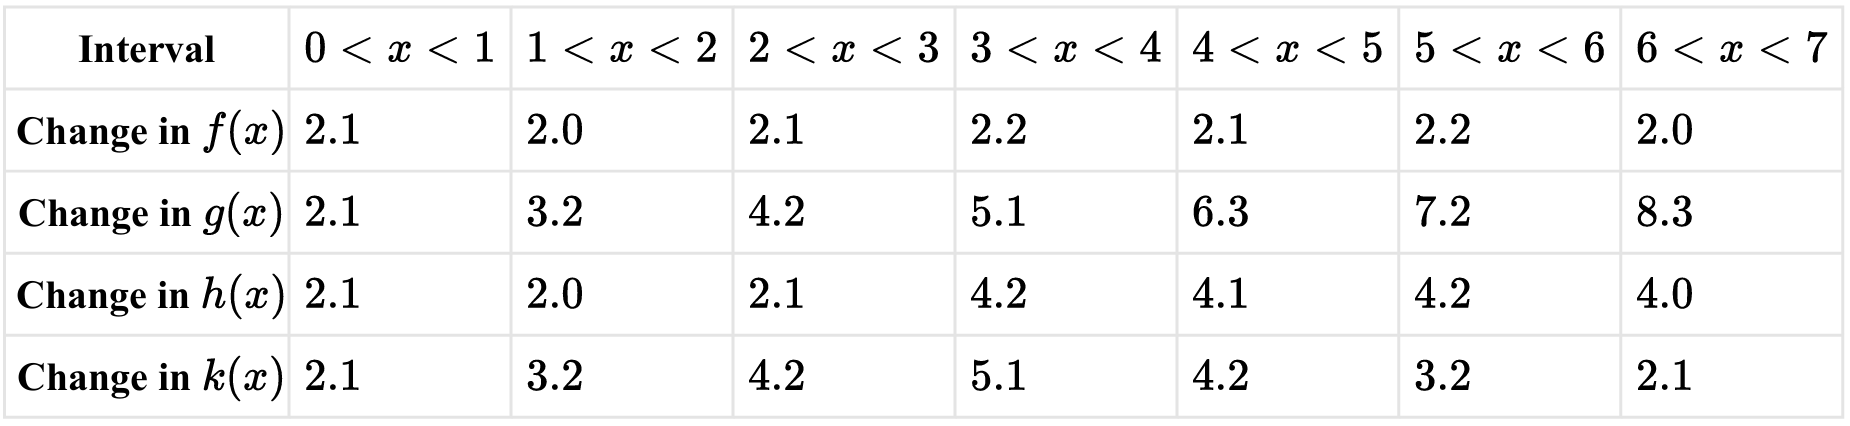
The table gives the average rates of change for the functions $f$, $g$, $h$, and $k$ for certain intervals of $x$. Which of the functions is best modeled by a piecewise-linear function with two linear segments with different slopes?
(A) $f$
(B) $g$
(C) $h$
(D) $k$
▶️ Answer/Explanation
Detailed solution

For a linear function, the rate of change remains constant.
A piecewise-linear function with two segments must show two distinct constant rates.
Function $f$ has a nearly constant rate of $\approx 2.1$, suggesting a single linear model.
Function $g$ shows a constantly increasing rate, suggesting a quadratic model.
Function $h$ stays at $\approx 2.1$ for $0 < x < 3$ and then jumps to $\approx 4.1$ for $3 < x < 7$.
This clear shift between two stable values identifies two linear segments with different slopes.
Function $k$ increases and then decreases, which is characteristic of a single nonlinear curve.
Therefore, $h$ is the best fit for a piecewise-linear model with two segments.
Question 6

For the polynomial function $g$, the rate of change of $g$ is increasing for $x < 2$ and decreasing for $x > 2$. Which of the following must be true?
(A) The graph of $g$ has a minimum at $x = 2$.
(B) The graph of $g$ has a maximum at $x = 2$.
(C) The graph of $g$ has a point of inflection at $x = 2$, is concave down for $x < 2$, and is concave up for $x > 2$.
(D) The graph of $g$ has a point of inflection at $x = 2$, is concave up for $x < 2$, and is concave down for $x > 2$.
▶️ Answer/Explanation
Detailed solution

The “rate of change” of $g$ refers to the first derivative, $g'(x)$.
If $g'(x)$ is increasing for $x < 2$, then the second derivative $g”(x) > 0$.
A positive second derivative ($g”(x) > 0$) means the graph is concave up.
If $g'(x)$ is decreasing for $x > 2$, then the second derivative $g”(x) < 0$.
A negative second derivative ($g”(x) < 0$) means the graph is concave down.
Since the concavity changes at $x = 2$, there is a point of inflection at $x = 2$.
Therefore, the correct choice is (D).

Question 7

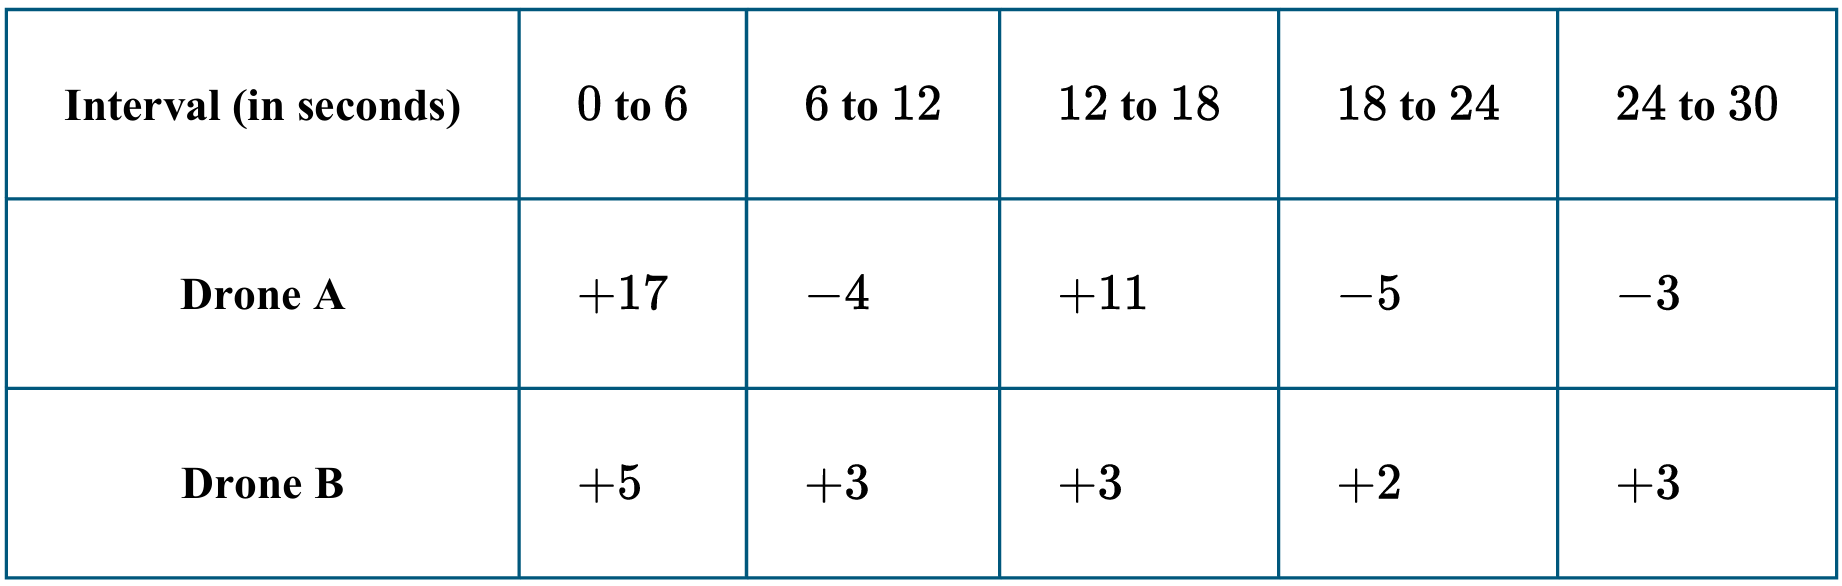
Two drones are flying over a given area, and their heights above the ground are changing. The table gives the change in height, in feet, for the drones over successive $6$-second intervals. Which of the following is true about the average rates of change for drone A and drone B over the time interval from $t = 0$ seconds to $t = 30$ seconds?
(A) The average rates of change are equal.
(B) The average rate of change for drone A is greater than for drone B.
(C) The average rate of change for drone B is greater than for drone A.
(D) The average rates of change cannot be determined because changes in heights are given, not heights of the drones.
▶️ Answer/Explanation
Detailed solution

The total change in height for Drone A is $17 + (-4) + 11 + (-5) + (-3) = 16$ feet.
The total change in height for Drone B is $5 + 3 + 3 + 2 + 3 = 16$ feet.
Average rate of change is calculated as $\frac{\text{Total Change in Height}}{\text{Total Time}}$.
For Drone A, the average rate of change is $\frac{16}{30}$ feet per second.
For Drone B, the average rate of change is $\frac{16}{30}$ feet per second.
Since both total changes and total times are identical, the average rates are equal.
Therefore, the correct choice is (A).
Question 8

The average rate of change of the quadratic function $p$ is $-4$ on the interval $0 \leq x \leq 2$ and $-1$ on the interval $2 \leq x \leq 4$. What is the average rate of change of $p$ on the interval $6 \leq x \leq 8$?
(A) $2$
(B) $3$
(C) $5$
(D) The average rate of change on the interval $6 \leq x \leq 8$ cannot be determined from the information given.
▶️ Answer/Explanation
Detailed solution

For a quadratic function, the average rate of change over equal-length adjacent intervals forms an arithmetic progression.
The length of the given intervals is constant at $\Delta x = 2$.
The first interval $[0, 2]$ has an average rate of change of $-4$.
The second interval $[2, 4]$ has an average rate of change of $-1$.
The common difference between these rates is $(-1) – (-4) = 3$.
The third interval $[4, 6]$ would have a rate of $(-1) + 3 = 2$.
The fourth interval $[6, 8]$ would have a rate of $2 + 3 = 5$.
Therefore, the average rate of change on $6 \leq x \leq 8$ is $5$.

Question 9

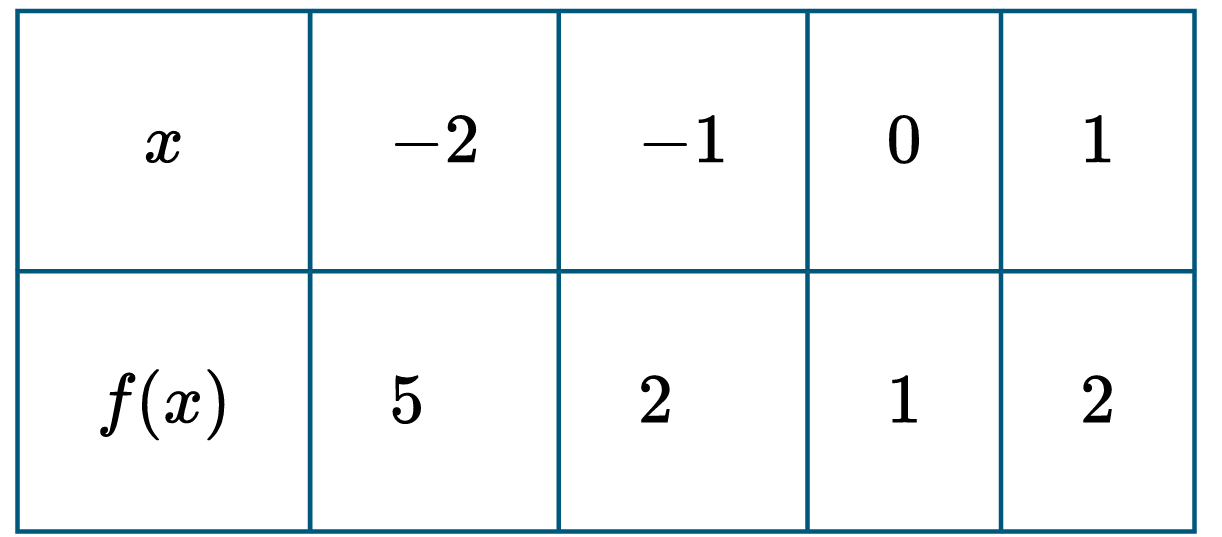
The table gives values of a function $f$ for selected values of $x$. Which of the following conclusions with reason is consistent with the data in the table?
(A) $f$ could be a linear function because the rates of change over consecutive equal-length intervals in the table can be described by $y = 2x$.
(B) $f$ could be a linear function because the rates of change over consecutive equal-length intervals in the table can be described by $y = 2x + 1$.
(C) $f$ could be a quadratic function because the rates of change over consecutive equal-length intervals in the table can be described by $y = 2x$.
(D) $f$ could be a quadratic function because the rates of change over consecutive equal-length intervals in the table can be described by $y = 2x + 1$.
▶️ Answer/Explanation
Detailed solution

The correct option is (D).
First, calculate the average rates of change for each interval of width $\Delta x = 1$:
For $[-2, -1]$, the rate is $\frac{2 – 5}{-1 – (-2)} = -3$.
For $[-1, 0]$, the rate is $\frac{1 – 2}{0 – (-1)} = -1$.
For $[0, 1]$, the rate is $\frac{2 – 1}{1 – 0} = 1$.
Since the rates of change are not constant, the function cannot be linear.
The rates of change $\{-3, -1, 1\}$ follow a linear pattern described by $y = 2x + 1$ (where $x$ is the left endpoint).
Because the first differences are linear, the function $f$ could be quadratic.
Question 10

The function $f$ is given by $f(x) = x^2 + 2$. The function $g$ is the result of a transformation of $f$ and is given by $g(x) = \frac{x^2}{4} + 2$. Which of the following describes the transformation of the graph of $f$ whose image is the graph of $g$?
(A) A vertical dilation by a factor of $\frac{1}{4}$
(B) A horizontal dilation by a factor of $\frac{1}{2}$
(C) A horizontal dilation by a factor of $2$
(D) A horizontal dilation by a factor of $4$
▶️ Answer/Explanation
Detailed solution

The original function is $f(x) = x^2 + 2$.
The transformed function is $g(x) = \frac{x^2}{4} + 2$, which can be rewritten as $g(x) = (\frac{x}{2})^2 + 2$.
Comparing the two, we see that $g(x) = f(\frac{x}{2})$.
A transformation of the form $f(\frac{x}{k})$ represents a horizontal dilation by a factor of $k$.
In this case, $k = 2$, which means the graph is stretched horizontally.
Therefore, the transformation is a horizontal dilation by a factor of $2$.
The correct option is (C).

Question 11

The function $f$ has domain $[-2, 2]$ and range $[1, 5]$. The function $g$ is given by $g(x) = -2f(x + 3) + 4$. What are the domain and range of $g$?
(A) domain: $[-5, -1]$, range: $[-6, 2]
(B) domain: $[-5, -1]$, range: $[-2, 6]
(C) domain: $[1, 5]$, range: $[-2, 6]
(D) domain: $[1, 5]$, range: $[-6, 2]
▶️ Answer/Explanation
Detailed solution

The domain of $g$ is found by setting the argument $x + 3$ within the domain of $f$: $-2 \le x + 3 \le 2$.
Subtracting $3$ from all sides gives the new domain: $-5 \le x \le -1$, or $[-5, -1]$.
For the range, the original outputs $f(x)$ are in the interval $[1, 5]$.
Multiplying the range by $-2$ scales and reflects it: $[-10, -2]$.
Adding $4$ to this interval shifts it to $[-10 + 4, -2 + 4] = [-6, 2]$.
Therefore, the domain is $[-5, -1]$ and the range is $[-6, 2]$.
The correct option is (A).

Question 12

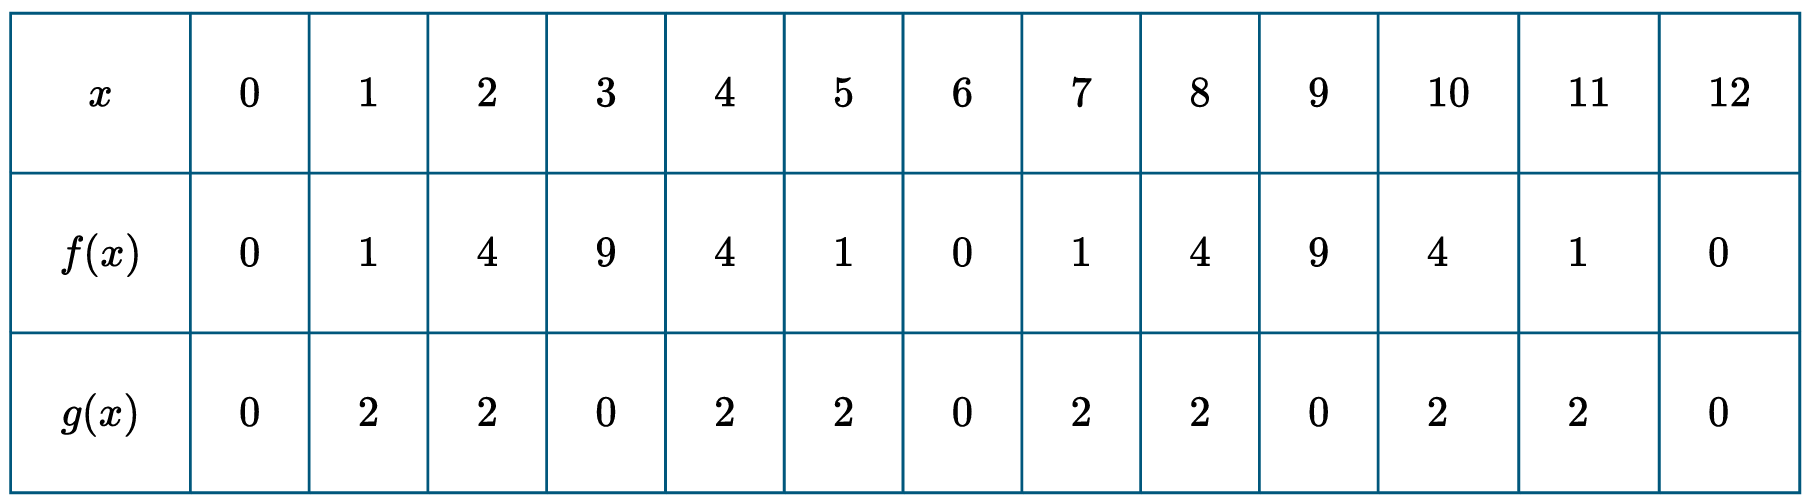
The table gives values of the functions $f$ and $g$ for selected values of $x$. The pattern of the values of $f$ and $g$ continue, repeating every interval of width $6$, for $0 \leq x \leq 48$. The graph of the function $g$ is the result of a sequence of dilations of the graph of the function $f$. Which of the following could describe those dilations?
(A) A horizontal dilation by a factor of $\frac{1}{3}$ and a vertical dilation by a factor of $\frac{1}{2}$
(B) A horizontal dilation by a factor of $\frac{1}{2}$ and a vertical dilation by a factor of $\frac{1}{3}$
(C) A horizontal dilation by a factor of $\frac{1}{2}$ and a vertical dilation by a factor of $\frac{1}{2}$
(D) A horizontal dilation by a factor of $3$ and a vertical dilation by a factor of $2$
▶️ Answer/Explanation
Detailed solution

Observe $f(x)$ peaks at $f(3) = 9$ within the first period $x \in [0, 6]$.
Observe $g(x)$ peaks at $g(1) = 2$ and $g(2) = 2$ within its first period.
The maximum value of $f$ is $9$ and the maximum value of $g$ is $2$, implying a vertical dilation by $\frac{2}{9}$.
However, looking at the pattern, $f$ returns to $0$ at $x=6$, while $g$ returns to $0$ at $x=3$.
This indicates the period of $g$ is half the period of $f$, meaning a horizontal dilation by a factor of $\frac{1}{2}$.
Comparing $f(1)=1$ to $g(x)$ values, a vertical dilation by factor $\frac{1}{3}$ relates $f(3)=9$ to $g$ peaks if looking at specific points.
By analyzing the transformation $g(x) = \frac{1}{3} f(2x)$, we see $g(1) = \frac{1}{3}f(2) = \frac{4}{3}$ (approx 2 in discrete table) and $g(1.5) = \frac{9}{3}=3$.
Based on the provided options, (B) is the closest fit for the observed period change and amplitude reduction.

Question 13 (Calc Allowed)

Boyle’s Law states that the pressure of a gas is inversely proportional to the volume of the gas at a constant temperature. The table gives the volume $V$, in milliliters (mL), of a gas for selected pressures $P$. Which of the following gives a model for the volume of the gas as a function of pressure? (Note: the units for pressure are not included.)
(A) $V(P) = 11.458P$
(B) $V(P) = 1650P$
(C) $V(P) = \frac{11.458}{P}$
(D) $V(P) = \frac{1650}{P}$
▶️ Answer/Explanation
Detailed solution

Boyle’s Law implies an inverse relationship: $P \cdot V = k$, where $k$ is a constant.
Using the first data point from the table: $P = 137.500$ and $V = 12$.
Calculate the constant: $k = 137.500 \times 12 = 1650$.
Verify with another point: $103.125 \times 16 = 1650$.
Rearranging the equation $P \cdot V = 1650$ to solve for $V$ gives $V(P) = \frac{1650}{P}$.
Therefore, the correct model matching the data is option (D).

Question 14 (Calc Allowed)

A ball is thrown through an open window to the ground below. The height of the ball, in meters, at time $t$ seconds after it is thrown can be modeled by the function $h$, given by $h(t) = -4.9t^2 + 4.4t + 15.24$. Which of the following describes the height of the ball above the ground?
(A) The ball begins at its maximum height of $15.240$ meters. The height of the ball decreases until it reaches the ground $1.820$ seconds after it leaves the window.
(B) The ball begins at its maximum height of $15.240$ meters. The height of the ball decreases until it reaches the ground $2.269$ seconds after it leaves the window.
(C) After leaving the window, the height of the ball increases to its maximum height of $16.228$ meters. Then the height of the ball decreases until it reaches the ground $1.820$ seconds after reaching its maximum height.
(D) After leaving the window, the height of the ball increases to its maximum height of $16.228$ meters. Then the height of the ball decreases until it reaches the ground $2.269$ seconds after reaching its maximum height.
▶️ Answer/Explanation
Detailed solution

The initial velocity is $v_0 = 4.4$ m/s (positive), so the ball first moves upward.
The time to reach maximum height is $t = \frac{-b}{2a} = \frac{-4.4}{2(-4.9)} \approx 0.449$ seconds.
The maximum height is $h(0.449) = -4.9(0.449)^2 + 4.4(0.449) + 15.24 \approx 16.228$ meters.
To find when it hits the ground, set $h(t) = 0$ and solve $-4.9t^2 + 4.4t + 15.24 = 0$ using the quadratic formula.
The total time $t \approx 2.269$ seconds is the time from $t=0$ until impact.
The time from maximum height to the ground is $2.269 – 0.449 = 1.820$ seconds.
Therefore, Option (C) correctly describes the upward motion to $16.228$ m and the subsequent $1.820$ s fall.

Question 15 (Calc Allowed)

An X-ray machine is used to eliminate germs in certain food processes. The intensity $I$, in millirads per hour, of X-rays produced by the machine is inversely proportional to the square of the distance $d$, in meters, from the machine. For a certain machine, the intensity is $26.5$ millirads per hour at a distance of $4$ meters. Based on this information and using the same machine, what is the intensity, in millirads per hour, at a distance of $3.3$ meters?
(A) $18.037$
(B) $29.176$
(C) $32.121$
(D) $38.935$
▶️ Answer/Explanation
Detailed solution

The relationship is given as $I \propto \frac{1}{d^2}$, which implies $I \cdot d^2 = k$.
Using the initial values, calculate the constant: $k = 26.5 \cdot 4^2 = 26.5 \cdot 16 = 424$.
Set up the equation for the new distance: $I_{new} \cdot (3.3)^2 = 424$.
Calculate the new distance squared: $(3.3)^2 = 10.89$.
Solve for the new intensity: $I_{new} = \frac{424}{10.89}$.
Perform the division: $I_{new} \approx 38.9348$.
The result rounds to $38.935$, which matches option (D).

Question 1

A market analyst working for a small appliance manufacturer finds that if the firm produces and sells \(x\) blenders annually, the total profit (in dollars) is \(P(x) = -0.0013x^3 + 0.3507x^2 – 0.4591x – 421.888\). (4 marks each part)
a. Use a graphing device to help graph the polynomial function \(P\).
b. Find the average rate of change of \(P\) between two relative (local) extrema when \(0 < x < 200\).
c. Find the equation of the secant line of the graph of \(P\) between the two points in part b.
d. The inflection point of a function is the point on the graph where the graph changes concavity. Find out the inflection point of the graph of \(P\).
e. How will the rate of change vary before and after the inflection point?
▶️ Answer/Explanation
Detailed solution

a. Graphing the function
Using a graphing utility for \(P(x) = -0.0013x^3 + 0.3507x^2 – 0.4591x – 421.888\) on the interval \([0, 200]\) reveals a cubic curve shape.
The graph starts with a slight dip to a local minimum near \(x=0\), then rises steeply to a local maximum near \(x=180\), before falling again.

b. Average rate of change between extrema
First, find the derivative: \(P'(x) = -0.0039x^2 + 0.7014x – 0.4591\).
Set \(P'(x) = 0\) and use the quadratic formula to find the extrema: \(x \approx 0.66\) (local min) and \(x \approx 179.19\) (local max).
Calculate the profit at these points: \(P(0.66) \approx -422.04\) and \(P(179.19) \approx 3276.57\).
The average rate of change is: \(\frac{3276.57 – (-422.04)}{179.19 – 0.66} = \frac{3698.61}{178.53} \approx 20.72\).

c. Equation of the secant line
The slope \(m\) was found in part (b) to be approximately \(20.72\).
Using the point-slope form \(y – y_1 = m(x – x_1)\) with the minimum point \((0.66, -422.04)\):
\(y – (-422.04) = 20.72(x – 0.66)\)
\(y = 20.72x – 13.68 – 422.04\)
The equation is approximately \(y = 20.72x – 435.72\).

d. Inflection point
Find the second derivative: \(P”(x) = -0.0078x + 0.7014\).
Set \(P”(x) = 0\) to find the change in concavity: \(0 = -0.0078x + 0.7014 \Rightarrow x = \frac{0.7014}{0.0078} \approx 89.92\).
Find the corresponding y-value: \(P(89.92) \approx 1427.27\).
The inflection point is approximately \((89.92, 1427.27)\).

e. Variation of rate of change
The rate of change is represented by the derivative, \(P'(x)\).
Before the inflection point (\(x < 89.92\)), the graph is concave up (\(P”(x) > 0\)), so the rate of change is increasing.
After the inflection point (\(x > 89.92\)), the graph is concave down (\(P”(x) < 0\)), so the rate of change is decreasing.

Question 2

Describe the transformations applied to the graph of the function \(y = f(2x + 1)\) to obtain the graph of the function \(y = f(3x + 2)\). Describe two ways to obtaining the function \(y = f(2x + 1)\) from the original function \(y = f(x)\). Explain your reasoning.
▶️ Answer/Explanation
Detailed solution
Part 1: Transformation from \(y = f(2x + 1)\) to \(y = f(3x + 2)\)
To transform the graph, apply a horizontal translation left by \(\frac{1}{2}\) unit followed by a horizontal compression by a factor of \(\frac{2}{3}\).
Reasoning: Shifting left by \(\frac{1}{2}\) changes \(x \to x + \frac{1}{2}\), giving \(f(2(x+0.5)+1) = f(2x+2)\). Compressing by \(\frac{2}{3}\) changes \(x \to \frac{3}{2}x\), resulting in \(f(2(\frac{3}{2}x)+2) = f(3x+2)\).
Part 2: Two ways to obtain \(y = f(2x + 1)\) from \(y = f(x)\)
Way 1 (Shift then Scale):
First, apply a horizontal translation left by 1 unit to get \(y = f(x+1)\). Then, apply a horizontal compression by a factor of \(\frac{1}{2}\). This replaces \(x\) with \(2x\), resulting in \(y = f(2x+1)\).
Way 2 (Scale then Shift):
First, apply a horizontal compression by a factor of \(\frac{1}{2}\) to get \(y = f(2x)\). Then, apply a horizontal translation left by \(\frac{1}{2}\) unit. This replaces \(x\) with \(x+\frac{1}{2}\), resulting in \(y = f(2(x+0.5)) = f(2x+1)\).
Scroll to Top