Question
Directions: Show all your work. Indicate clearly the methods you use, because you will be scored on the correctness of your methods as well as on the accuracy and completeness of your results and explanations.
As part of a study on the chemistry of Alaskan streams, researchers took water samples from many streams with temperatures colder than \(8^{\circ} \mathrm{C}\) and from many streams with temperatures warmer than \(8^{\circ} \mathrm{C}\). For each sample, the researchers measured the dissolved oxygen concentration, in milligrams per liter (mg/l).
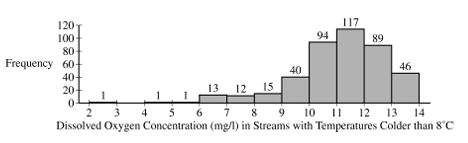
Dissolved Oxygen Concentration \((\mathrm{mg} / \mathrm{l})\) in Streams with Temperatures Colder than \(8^{\circ} \mathrm{C}\)
(a) The researchers constructed the histogram shown for the dissolved oxygen concentration in streams from the sample with water temperatures colder than \(8^{\circ} \mathrm{C}\). Based on the histogram, describe the distribution of dissolved oxygen concentration in streams with water temperatures colder than \(8^{\circ} \mathrm{C}\)
 .
.
(b) The researchers computed the summary statistics shown in the table for the dissolved oxygen concentration in streams from the sample with water temperatures warmer than \(8^{\circ} \mathrm{C}\). Use the summary statistics to construct a box plot for the dissolved oxygen concentration in streams with water temperatures warmer than \(8^{\circ} \mathrm{C}\). Do not indicate outliers.

(c) The researchers believe that streams with higher dissolved oxygen concentration are generally healthier for wildlife. Which streams are generally healthier for wildlife, those with water temperature colder than \(8^{\circ} \mathrm{C}\) or those with water temperature warmer than \(8^{\circ} \mathrm{C}\) ? Using characteristics of the distribution of dissolved oxygen concentration for temperatures colder than \(8^{\circ} \mathrm{C}\) and characteristics of the distribution of dissolved oxygen concentration for temperatures warmer than \(8^{\circ} \mathrm{C}\), justify your answer.
▶️Answer/Explanation
Ans:
(a) The distribution of dissolved oxygen concentration in streams with water temperatures colder than \(8^{\circ} \mathrm{C}\) is skewed to the left, with a median between 11 and \(12 \mathrm{mg} / 1\), a range between \(10 \times 12 \mathrm{mg} / \mathrm{l}\), and a possible outlier between 2 and \(3 \mathrm{mg} / 1\).
(b)

(C) Streams with water temperatures colder than \(8^{\circ} \mathrm{C}\) are generally healthier for wildlife because the median oxygen concentration for the distribution of temperatures from streams less than \(8^{\circ}\) is between 11 and \(12 \mathrm{mg} / 1\), which is greater than the median of \(5.43 \mathrm{mg} / 1\) for streams warmer than \(8^{\circ}\). In addition, 75\% of the streams with temperatures warmer than \(8^{\circ} \mathrm{C}\) are less than \(6.12 \mathrm{mg} / \mathrm{l}\) but in streams with temperatures colder than \(8^{\circ} \mathrm{C}\) at least \(413 / 429=96.3 \%\). are greater than \(6.12 \mathrm{mg} / 1\).
Question
Bath fizzies are mineral tablets that dissolve and create bubbles when added to bathwater. In order to increase sales, the Fizzy Bath Company has produced a new line of bath fizzies that have a cash prize in every bath fizzy. Let the random variable, \(X\), represent the dollar value of the cash prize in a bath fizzy. The probability distribution of \(X\) is shown in the table.
(a) Based on the probability distribution of \(X\), answer the following. Show your work.
(i) Calculate the proportion of bath fizzies that contain \(\$ 1\).
(ii) Calculate the proportion of bath fizzies that contain at least \(\$ 10\).
(b) Based on the probability distribution of \(X\), calculate the probability that a randomly selected bath fizzy contains \(\$ 100\), given that it contains at least \(\$ 10\). Show your work.
(c) Based on the probability distribution of \(X\), calculate and interpret the expected value of the distribution of the cash prize in the bath fizzies. Show your work.
(d) The Fizzy Bath Company would like to sell the bath fizzies in France, where the currency is euros. Suppose the conversion rate for dollars to euros is 1 dollar \(=0.89\) euros. Using your expected value from
part (c), calculate the expected value, in euros, of the distribution of the cash prize in the bath fizzies. Show your work.
▶️Answer/Explanation
Ans:
(a) (i) \(P(x=1)=1-(0.2+0.05+0.05+0.01+0.01)=0.68\)
(ii) \(P(x \geq 10)=0.05+0.05+0.01+0.01=0.12\)
(b) \(P(x=100 \mid x \geq 10)=\frac{0.01}{0.12}=0.083\)
(c)
$
\begin{aligned}
E(x) & =1(0.68)+5(0.2)+10(0.05)+20(0.05)+50(0.01)+100(0.01) \\
& =\$ 4.68
\end{aligned}
$
If many, many bath fizzy were opened, the average amount for the prize is about \(\$ 4.68\) in the long run.
(d) \(\$ 4.68 \times \frac{0.89 \text { euros }}{\$ 1}=4.1652\) euros
Question
A medical researcher completed a study comparing an omega- 3 fatty acids supplement to a placebo in the treatment of irritability in patients with a certain medical condition. Nineteen patients with the medical condition volunteered to participate in the study. The study was conducted using the following weekly schedule.
- Week 1: Each patient took a randomly assigned treatment, omega-3 supplement or placebo.
- Week 2: The patients did not take either the omega- 3 supplement or the placebo. This was necessary to reduce the possibility of any carryover effect from the assigned treatment taken during week 1 .
- Week 3: Each patient took the treatment, omega-3 supplement or placebo, that they did not take during week 1 .
At the end of week 1 and week 3 , each patient’s irritability was given a score on a scale of 0 to 10 , with 0 representing no irritability and 10 representing the highest level of irritability.
For each patient, the two irritability scores and the difference in their scores (placebo minus omega-3) were recorded. The results are summarized in the table and boxplots.


The researcher claims the omega-3 supplement will decrease the mean irritability score of all patients with the medical condition similar to the volunteers who participated in the study. Is there convincing statistical evidence to support the researcher’s claim at a significance level of \(\alpha=0.05\) ? Complete the appropriate inference procedure to support your answer.
▶️Answer/Explanation
Ans:
(4) \(H_0: \mu_{\text {diff }}=0 \quad \mu_{\text {diff }}=\) true mean difference in irritability \(H_a: M_{\text {diff }}>0 \quad\) scores (place o-Omega 3). for all patients with the medical condition similar to volunteers in the study
One sample t-test for \(M_{\text {diff }}\) (matched pairs + test)
Conditions: – Random: The order of treatments was randomly assigned
– Normal/Large Sample: The boxpot of differences shows no strong skew or outliers
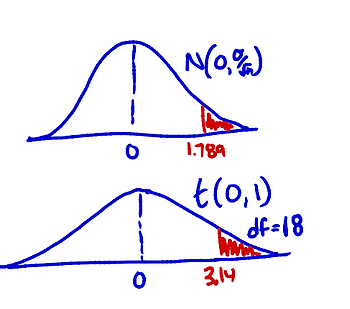
\(\begin{aligned} & \text { standardized }=\frac{\text { statistic }- \text { parameter }}{\text { test statistic }} \\ & t=\frac{\bar{x}_{\text {diff }}-M_{\text {diff }}}{s_{\text {diff }} / \sqrt{n}}=\frac{1.789-0}{2.485 / \sqrt{19}} \\ & t=3.14 \\ & P \text {-value }=0.0028\end{aligned}\)
Because 0.0028<0.05, we reject \(H_0\) and there is convincing evidence that the omega-3 supplement will decrease the mean irritability score of all patients with the medical condition similar to the volunteers that participated in the study.
Question
Wildlife biologists are interested in the health of tule elk, a species of deer found in California. An important measurement of tule elk health is their weight. The weight of a tule elk is difficult to measure in the wild. However, chest circumference, which is believed to be related to the weight of a tule elk, can easily be measured from a safe distance using a harmless laser. A study was done to investigate whether chest circumference, in centimeters \((\mathrm{cm})\), could be used to accurately estimate the weight, in kilograms \((\mathrm{kg})\), of male tule elk. For the study, wildlife biologists captured 30 male tule elk, measured their chest circumference and weight, and then released the elk. The data for the 30 male tule elk are shown in the scatterplot.

(a) Describe the relationship between chest circumference and weight of male tule elk in context.
Following is the equation of the least-squares regression line relating chest circumference and weight for male tule elk.
$
\text { predicted weight }=-350.3+3.7455 \text { (chest circumference) }
$
(b) The weight of one male tule elk with a chest circumference of \(145.9 \mathrm{~cm}\) is \(204.3 \mathrm{~kg}\).
(i) Using the equation of the least-squares regression line, calculate the predicted weight for this male tule elk. Show your work.
(ii) Calculate the residual for this male tule elk. Show your work.
The equation of the least-squares regression line relating chest circumference and weight for male tule elk is repeated here.
$
\text { predicted weight }=-350.3+3.7455 \text { (chest circumference) }
$
(c) Interpret the slope of the least-squares regression line in context.
(d) The sambar, another species of deer, is similar in size to the tule elk. The slope of the population regression line relating chest circumference and weight for all male sambars is 4.5 kilograms per centimeter. A wildlife biologist wants to determine whether the slope of the population regression line for male tule elk is different than that for male sambars. Let \(\beta\) represent the slope of the population regression line for male tule elk. The wildlife biologist conducted a test of the following hypotheses using the sample of 30 tule elk.
$
\begin{aligned}
& \mathrm{H}_0: \beta=4.5 \\
& \mathrm{H}_{\mathrm{a}}: \beta \neq 4.5
\end{aligned}
$
The test statistic was calculated to be 3.408 . Assume all conditions for inference were met.
(i) Determine the \(p\)-value of the test.
(ii) At a significance level of \(\alpha=0.05\), what conclusion should the wildlife biologist make regarding the slope of the population regression line for male tule elk? Justify your response.
▶️Answer/Explanation
Ans:
(a) There is a strong, positive, linear relationship between chest circumference and weight of male tole elk.
(b) (i) weight \(=-350.3+3.7455(145.9)=196.17 \mathrm{~kg}\).
(ii) residual \(=204.3-196.17=8.13 \mathrm{~kg}\).
(c) For every increase of \(1 \mathrm{~cm}\) of chest circumference, the predicted weight for male tole elks increases by \(3.7455 \mathrm{~kg}\).

\(2 \times \operatorname{tcdf}(3.408,9999,28)\)
\(P\)-value \(=0.002\)
(ii) Assuming \(H_0\) is true \((B=4.5)\), there is a 0.002 probability of getting the obtained sample slope or more extreme in either direction purely by chance.
Because \(0.002<0.05\), we reject \(H_0\) and do have convincing evidence that the slope of the population regression line for male tole elk is different than \(4.5 \mathrm{~kg} / \mathrm{cm}\).
Question
A jewelry company uses a machine to apply a coating of gold on a certain style of necklace. The amount of gold applied to a necklace is approximately normally distributed. When the machine is working properly, the amount of gold applied to a necklace has a mean of 300 milligrams \((\mathrm{mg})\) and standard deviation of \(5 \mathrm{mg}\).
(a) A necklace is randomly selected from the necklaces produced by the machine. Assuming that the machine is working properly, calculate the probability that the amount of gold applied to the necklace is between \(296 \mathrm{mg}\) and \(304 \mathrm{mg}\).
The jewelry company wants to make sure the machine is working properly. Each day, Cleo, a statistician at the jewelry company, will take a random sample of the necklaces produced that day. Each selected necklace will be melted down and the amount of the gold applied to that necklace will be determined. Because a necklace must be destroyed to determine the amount of gold that was applied, Cleo will use random samples of size \(n=2\) necklaces.
Cleo starts by considering the mean amount of gold being applied to the necklaces. After Cleo takes a random sample of \(n=2\) necklaces, she computes the sample mean amount of gold applied to the two necklaces.
(b) Suppose the machine is working properly with a population mean amount of gold being applied of \(300 \mathrm{mg}\) and a population standard deviation of \(5 \mathrm{mg}\).
(i) Calculate the probability that the sample mean amount of gold applied to a random sample of \(n=2\) necklaces will be greater than \(303 \mathrm{mg}\).
(ii) Suppose Cleo took a random sample of \(n=2\) necklaces that resulted in a sample mean amount of gold applied of \(303 \mathrm{mg}\). Would that result indicate that the population mean amount of gold being applied by the machine is different from \(300 \mathrm{mg}\) ? Justify your answer without performing an inference procedure.
Now, Cleo will consider the variation in the amount of gold the machine applies to the necklaces. Because of the small sample size, \(n=2\), Cleo will use the sample range of the data for the two randomly selected necklaces, rather than the sample standard deviation.
Cleo will investigate the behavior of the range for samples of size \(n=2\). She will simulate the sampling distribution of the range of the amount of gold applied to two randomly sampled necklaces. Cleo generates 100,000 random samples of size \(n=2\) independent values from a normal distribution with mean \(\mu=300\) and standard deviation \(\sigma=5\). The range is calculated for the two observations in each sample. The simulated sampling distribution of the range is shown in Graph I. This process is repeated using \(\sigma=8\), as shown in Graph II, and again using \(\sigma=12\), as shown in Graph III.


(c) Use the information in the graphs to complete the following.
(i) Describe the sampling distribution of the sample range for random samples of size \(n=2\) from a normal distribution with standard deviation \(\sigma=5\), as shown in Graph I.
(ii) Describe how the sampling distribution of the sample range for samples of size \(n=2\) changes as the value of the population standard deviation \(\sigma\) increases.
Recall that Cleo needs to consider both the mean and standard deviation of the amount of gold applied to necklaces to determine whether the machine is working properly. Suppose that one month later, Cleo is again checking the machine to make sure it is working properly. Cleo takes a random sample of 2 necklaces and calculates the sample mean amount of gold applied as \(303 \mathrm{mg}\) and the sample range as \(10 \mathrm{mg}\).
(d) Recall that the machine is working properly if the amount of gold applied to the necklaces has a mean of \(300 \mathrm{mg}\) and standard deviation of \(5 \mathrm{mg}\).
(i) Consider Cleo’s range of \(10 \mathrm{mg}\) from the sample of size \(n=2\). If the machine is working properly with a standard deviation of \(5 \mathrm{mg}\), is a sample range of \(10 \mathrm{mg}\) unusual? Justify your answer.
(ii) Do Cleo’s sample mean of \(303 \mathrm{mg}\) and range of \(10 \mathrm{mg}\) indicate that the machine is not working properly? Explain your answer.
▶️Answer/Explanation
Ans:

\(\begin{aligned} & z=\frac{304-300}{5}=0.8 \\ & z=\frac{296-300}{5}=-0.8\end{aligned}\)
Area \(=0.7881-0.2119=0.5762\)

\(\begin{aligned} & z=\frac{303-300}{5 / \sqrt{2}}=0.85 \\ & \text { Area }=1-0.8023=0.1977\end{aligned}\)
(ii) No. Assuming the machine is working properly \((M=300)\), there is a \(0.1977 \times 2=0.3954\) probability of getting a sample mean of 303 or more extreme in either direction purely by chance. Because \(0.3954>0.05\) we do not have convincing evidence the mean amount of gold is different from \(300 \mathrm{mg}\).
(c)
(i) The distribution of sample range for random samples of size \(n=2\) from a normal distribution of amount of gold with standard deviation \(\sigma=5\) is skewed to the right, with a median between \(4.5 \mathrm{mg}\) a range of about \(28 \mathrm{mg}\) and no obvious outliers.
(ii) As the population standard deviation \(\sigma\) increases, the graphs become more skewed right and the medians and ranges increase.
(d)(i)
$
\begin{aligned}
P(\text { sample range } \geq 10) \approx & 0.04+0.03+0.02+0.02+0.02 \\
& +0.01+0.01+0.01+0.005+0.005 \\
\approx & 0.17
\end{aligned}
$
Assuming the machine is working properly \((\sigma=S)\), there is about a 0.17 probability of getting a sample range of 10 or higher purely by chance.
Because \(0.17>0.05\), this is not unusual.
(ii)
$
\begin{aligned}
& P(\bar{x} \geq 303 \text { or } \bar{x} \leq 297 \mid \mu=300)=0.3954 \\
& P(\text { sample range } \geq 10 \mid \sigma=5)=0.17 \\
& P(\bar{x} \geq 303 \text { or } \bar{x} \leq 297 \text { AND sample range } \geq 10 \mid \mu=300 * \sigma=5) \\
& =0.3954 \times 0.17=0.067
\end{aligned}
$
Assuming the machine is working properly \((\mu=300\) and \(\sigma=5)\) there is a 0.067 probability of getting Cleo’s result or more extreme purely by chance. Because \(0.007>0.05\) we do not have convincing evidence the machine is not working properly.