Question
Robin works as a server in a small restaurant, where she can earn a tip (extra money) from each customer she serves. The histogram below shows the distribution of her 60 tip amounts for one day of work.

(a) Write a few sentences to describe the distribution of tip amounts for the day shown.
(b) One of the tip amounts was \(\$ 8\). If the \(\$ 8\) tip had been \(\$ 18\), what effect would the increase have had on the following statistics? Justify your answers.
The mean:
The median:
▶️Answer/Explanation
Ans:
The shape of the distribution of tip amounts is heavily skewed right. The center (median) is 63 dollars. The range (spread) is 22.5 and there is one potential outlier of 20 dollars.
The mean:
This would cause the mean to increase because adding / subtracting affect .s the mean of a distribution. Since \(\$ 18\) is larger than \$8, the mean would also be larger as the sum of the tipswefore dividing by for tips to find the mean would be higher.
The median:
The median would not be affected. Because there were 60 tips, the median would still be in the \((2.5,5)\) range of the histogram as it would fall between the \(30^{\text {th }}\) and \(31^{\text {st }}\) tip.
Question
Product advertisers studied the effects of television ads on children’s choices for two new snacks. The advertisers used two 30 -second television ads in an experiment. One ad was for a new sugary snack called Choco-Zuties, and the other ad was for a new healthy snack called Apple-Zuties.
For the experiment, 75 children were randomly assigned to one of three groups, A, B, or C. Each child individually watched a 30 -minute television program that was interrupted for 5 minutes of advertising. The advertising was the same for each group with the following exceptions.
- The advertising for group A included the Choco-Zuties ad but not the Apple-Zuties ad.
- The advertising for group B included the Apple-Zuties ad but not the Choco-Zuties ad.
- The advertising for group \(\mathrm{C}\) included neither the Choco-Zuties ad nor the Apple-Zuties ad.
After the program, the children were offered a choice between the two snacks. The table below summarizes their choices.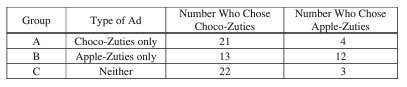
(a) Do the data provide convincing statistical evidence that there is an association between type of ad and children’s choice of snack among all children similar to those who participated in the experiment?
(b) Write a few sentences describing the effect of each ad on children’s choice of snack.
▶️Answer/Explanation
Ans:
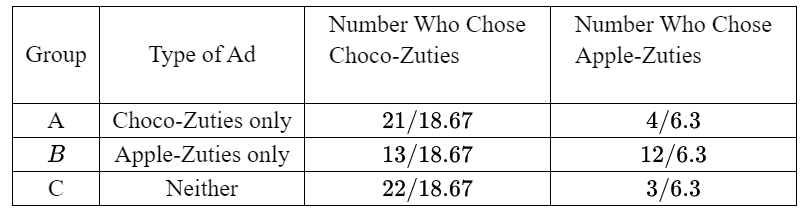
H\({o}\): The hall hypothesis is that H\({a}\): the type of ad has no affect \(x^2\) test of hamogeniety on what sneck the children Conditions: choose. The alterative hypothesis is that The type of add shown does have an effect on what snow the chicken Choose. Let alpha \(=.05\)
\(\begin{aligned} & x^2=10.29 \\ & p-v a l=.006 \\ & d f=2\end{aligned}\)
Since D-vell is less than \(\alpha\) reject Ho: There is encocepn evidence to sagffest then the tare of ad the children watered affected what snath they Choose
Mordan-
stated
Independent
Obesemplect
? Chil dwen’t Affat
the otner since they
wereseperelted.
Canted Delta Grater
thens: yes
\(\frac{56.25}{75} \quad \frac{19.75}{75}\)
b)According ter the lest there is enough evidence to suggest that the type ot ad the chi ts cherened nos an effect on wnatshacts they choose. thewever we still have fo tate into ceccunt the contending variables. It is possible that sem children jest really like uncolote for example.
Question
Alzheimer’s disease results in a loss of cognitive ability beyond what is expected with typical aging. A local newspaper published an article with the following headline.
![]()
Study Finds Strong Association Between Smoking and Alzheimer’s
The article reported that a study tracked the medical histories of 21,123 men and women for 23 years. The article stated that, for those who smoked at least two packs of cigarettes a day, the risk of developing Alzheimer’s disease was 2.57 times the risk for those who did not smoke.
(a) Identify the explanatory and response variables in the study.
Explanatory variable:
Response variable:
(b) Is the study described in the article an observational study or an experiment? Explain.
(c) Exercise status (regular weekly exercise versus no regular weekly exercise) was mentioned in the article as a possible confounding variable. Explain how exercise status could be a confounding variable in the study.
▶️Answer/Explanation
Ans:
Explanatory variable:
The explanatory variable was whether or not the individual smoked at least two parts of cigarettes a day.
Response variable:
The response variable was whether or not the individual developed Alzheimer’s disease.
The study described in the article is an observational study, not an experiment. This is because the researchers merely tracked the individuals by analyzing their medical histories. An experiment would need to impose a treatment on the subjects (egg. assigning them to smoke or not to smakel, which this study did not do, making it an observational study.
Exercise could be a contouring variable as those who exercise regularly may not be as at risk for Alzheimer’s disease. Additionally, smokers may be more likely not to howe regular weekly exercise compared to nonsmokers. Therefore the observed action is unknown to have been produced as a result of smoking or a lack of weekly exercise, making exercise status a potential confounding variable.
Question
A polling agency showed the following two statements to a random sample of 1,048 adults in the United States.
Environment statement: Protection of the environment should be given priority over economic growth.
Economy statement: Economic growth should be given priority over protection of the environment.
The order in which the statements were shown was randomly selected for each person in the sample. After reading the statements, each person was asked to choose the statement that was most consistent with his or her opinion. The results are shown in the table.
![]()
(a) Assume the conditions for inference have been met. Construct and interpret a 95 percent confidence interval for the proportion of all adults in the United States who would have chosen the economy statement.
(b) One of the conditions for inference that was met is that the number who chose the economy statement and the number who did not choose the economy statement are both greater than 10 . Explain why it is necessary to satisfy that condition.
(c) A suggestion was made to use a two-sample \(z\)-interval for a difference between proportions to investigate whether the difference in proportions between adults in the United States who would have chosen the environment statement and adults in the United States who would have chosen the economy statement is statistically significant. Is the two-sample \(z\)-interval for a difference between proportions an appropriate procedure to investigate the difference? Justify your answer.
▶️Answer/Explanation
Ans:
(a) I will construct a one saiph z interval for \(p\).
\(P=\) the hive proportion of US adults who would choose the elcomy statement
Population: All v5 adults
\(\begin{aligned} & \hat{p} \pm 2 \sqrt{\frac{p(f p}{r}} \\ & .37 \pm 1.96 \sqrt{\frac{.32(.63)}{1048}} \\ & .37 \pm 1.96(.0149) \\ & .37 \pm 0782 \\ & (.3408, .3992)\end{aligned}\)
I am \(95 \%\) confident that the true proportion of US adults that would have chosinthe economy statement is between \(34.08 \%\) and \(39.92 \%\).
(b)This coalition allows the experimenter to assume that the distribution of sample proportions is approximately normal. Because we are estimating the probability of the sample proportion using the normal curve, it is necessary to satisfy this condition in order to proved with the construction of the interval.
(c) No, it is not an appropriate procedure. A condition to una two sample 2 procedure is that there must bo two samples that are in dependent of each otur. Be case the participants were asked to choose between the two statements, the proportion of participants who chose the environment is dependent on the proportion of participants who chose the economy statement. This survey does not satisfy the conditions for a twe-sample 2 procedure.
Question
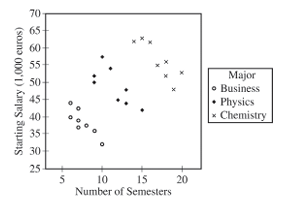
A newspaper in Germany reported that the more semesters needed to complete an academic program at the university, the greater the starting salary in the first year of a job. The report was based on a study that used a random sample of 24 people who had recently completed an academic program. Information was collected on the number of semesters each person in the sample needed to complete the program and the starting salary, in thousands of euros, for the first year of a job. The data are shown in the scatterplot below.
(a) Does the scatterplot support the newspaper report about number of semesters and starting salary? Justify your answer.
The table below shows computer output from a linear regression analysis on the data.
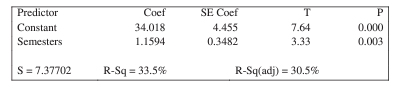
(b) Identify the slope of the least-squares regression line, and interpret the slope in context.
An independent researcher received the data from the newspaper and conducted a new analysis by separating the data into three groups based on the major of each person. A revised scatterplot identifying the major of each person is shown below.

(c) Based on the people in the sample, describe the association between starting salary and number of semesters for the business majors.
(d) Based on the people in the sample, compare the median starting salaries for the three majors.
(e) Based on the analysis conducted by the independent researcher, how could the newspaper report be modified to give a better description of the relationship between the number of semesters and the starting salary for the people in the sample?
▶️Answer/Explanation
Ans:
(a)Yes, because there is a positive correlation shown btw semesters in the program and starting salary, even if the correlation is not extremely strong.
(b)$
\hat{y}=1.1594 x+34.018
$
1.1594 is the slope of the least squares regression line. It says that for every additional semester starting salary increases by 1.1594 thousand Euros (on average).
(c)There is a moderately strong negative correlation btw the number of semesters in a program and starting salary. for buisness majors
(d)Chemistry has the highest median starting salary, followed by Physics and then buisness.
(e)Majors that typically take longer to complete tend to come with higher starting salaries, however, taking longer than average than other peers in your major tends to lead to a lower starting salary.